
FIGURE 15.
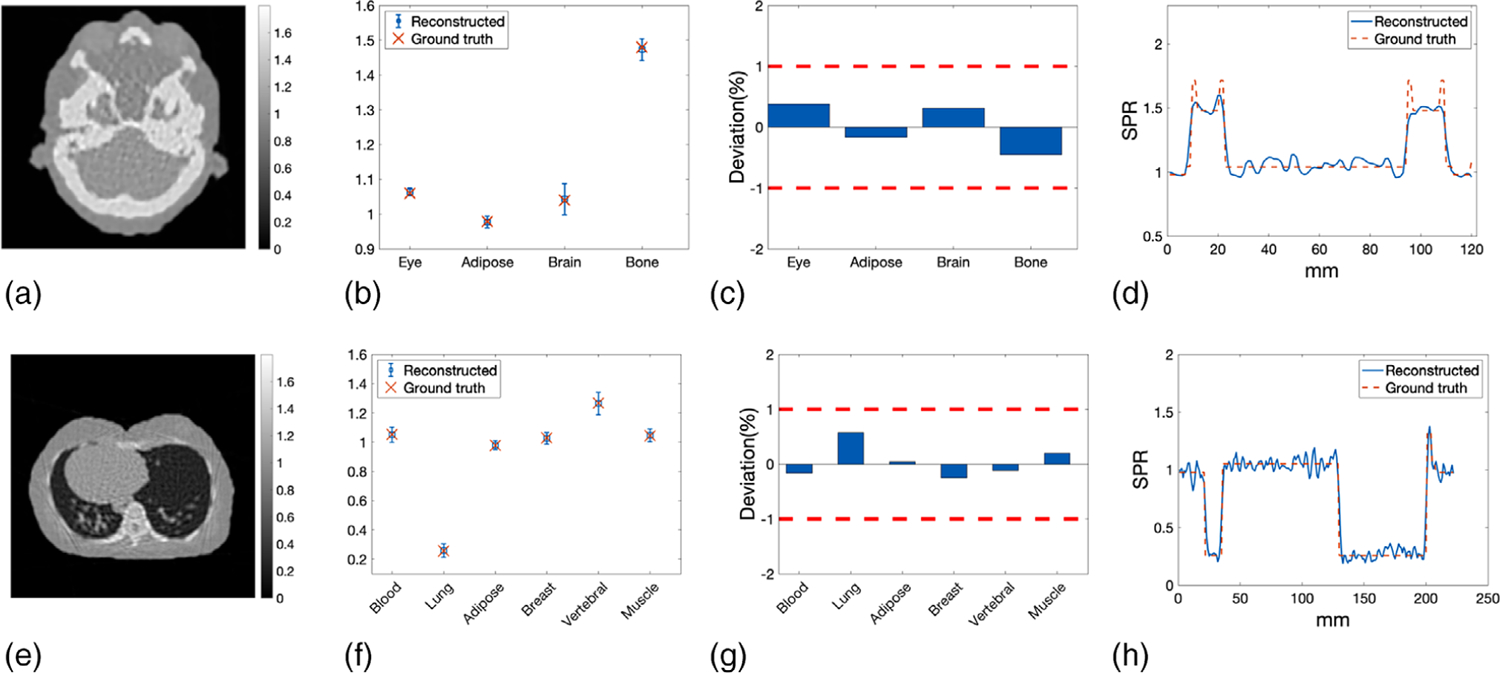
(a) Reconstructed SPR distribution of the head slice from the corrected WEPL with additional smoothing. (b) Mean and STD of smoothed SPR of the head slice calculated in selected ROIs compared with reference values. (c) Percentage deviation of mean SPR of the head slice from the reference values. The two red dashed lines indicated the ±1% target deviation. (d) Profile along the line delineated in Figure 10(a) of smoothed SPR compared with that of the reference SPR. (e) Reconstructed SPR distribution of the lung slice from the corrected WEPL with additional smoothing. (f) Mean and STD of smoothed SPR calculated in selected ROIs of the lung slice compared with reference values. (g) Percentage deviation of mean SPR of the lung slice from the reference values. The two red dashed lines indicated the ±1% target deviation. (h) Profile along the line delineated in Figure 13(a) of smoothed SPR compared with that of the reference SPR