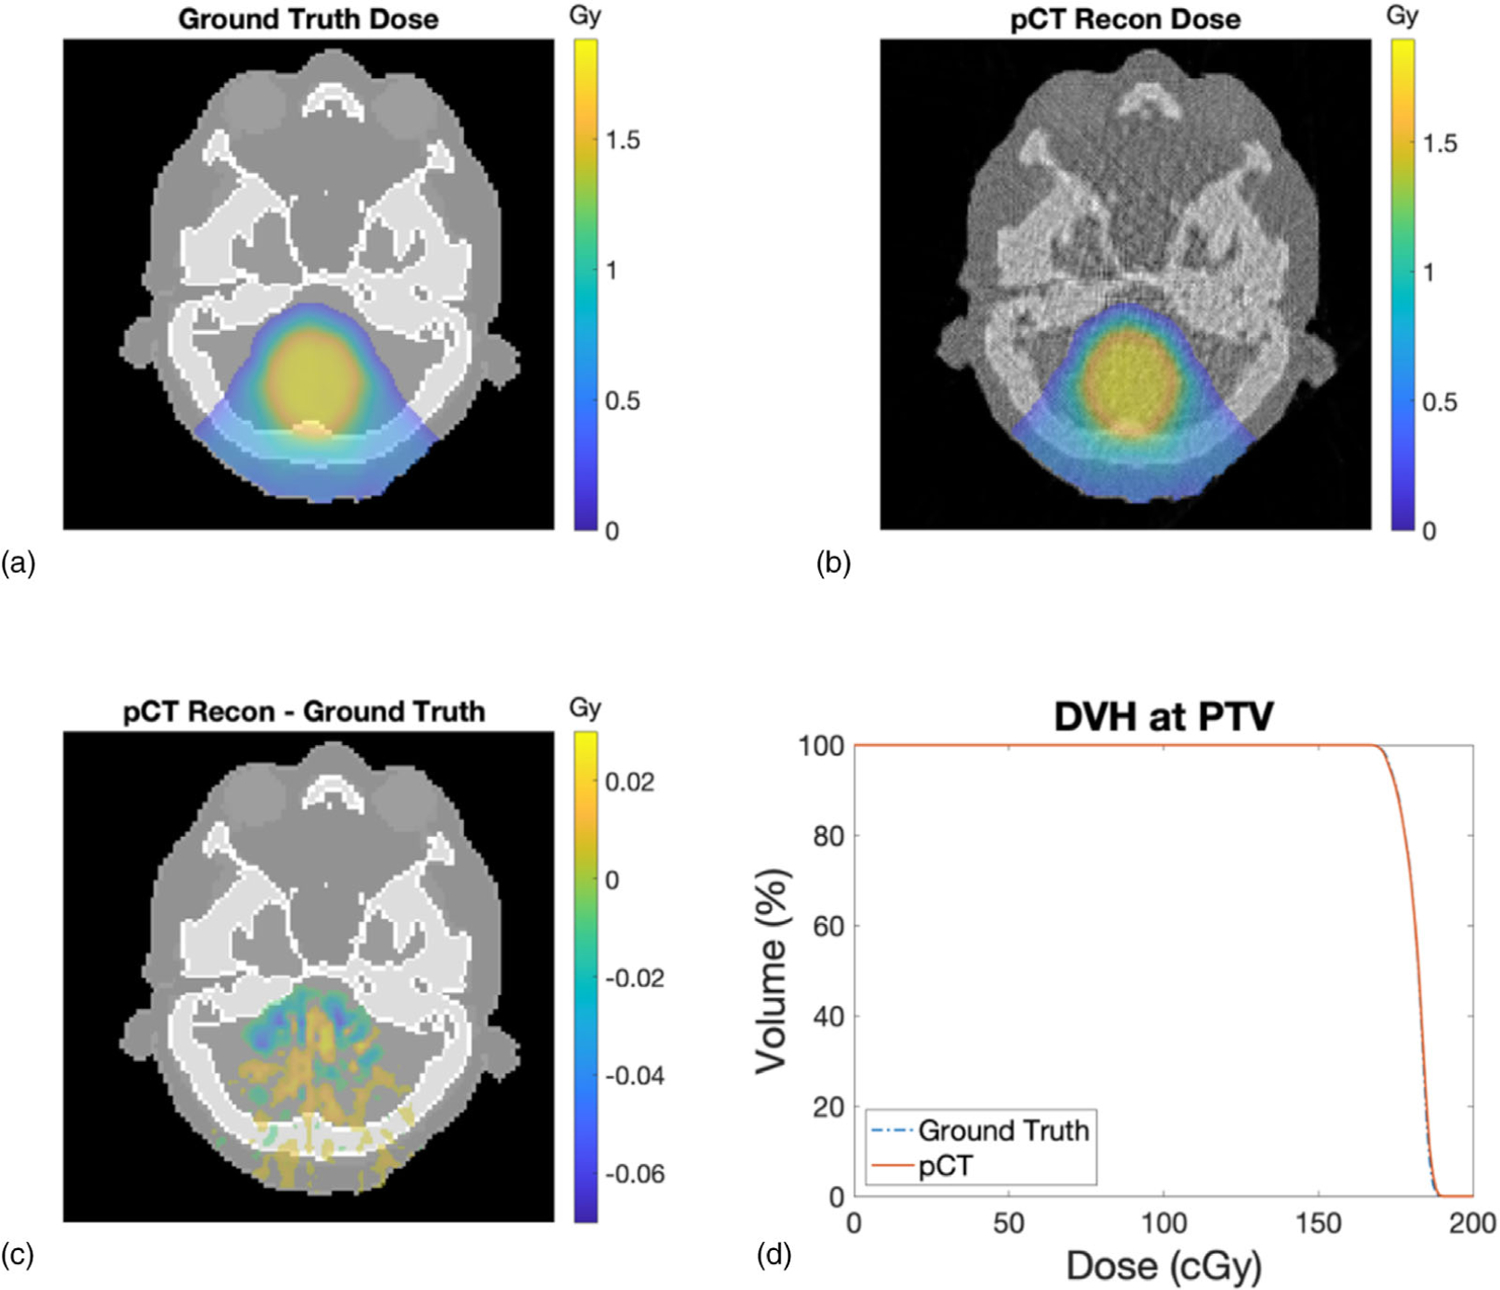
FIGURE 17.

(a) Dose distribution calculated on the reference ICRP SPR image. (b) Dose distribution calculated on the reconstructed SPR image from the pCT simulation. (c) Dose difference between the reference ICRP and reconstructed pCT SPR images. (d) Comparison of PTV DVH
