
FIGURE 18.
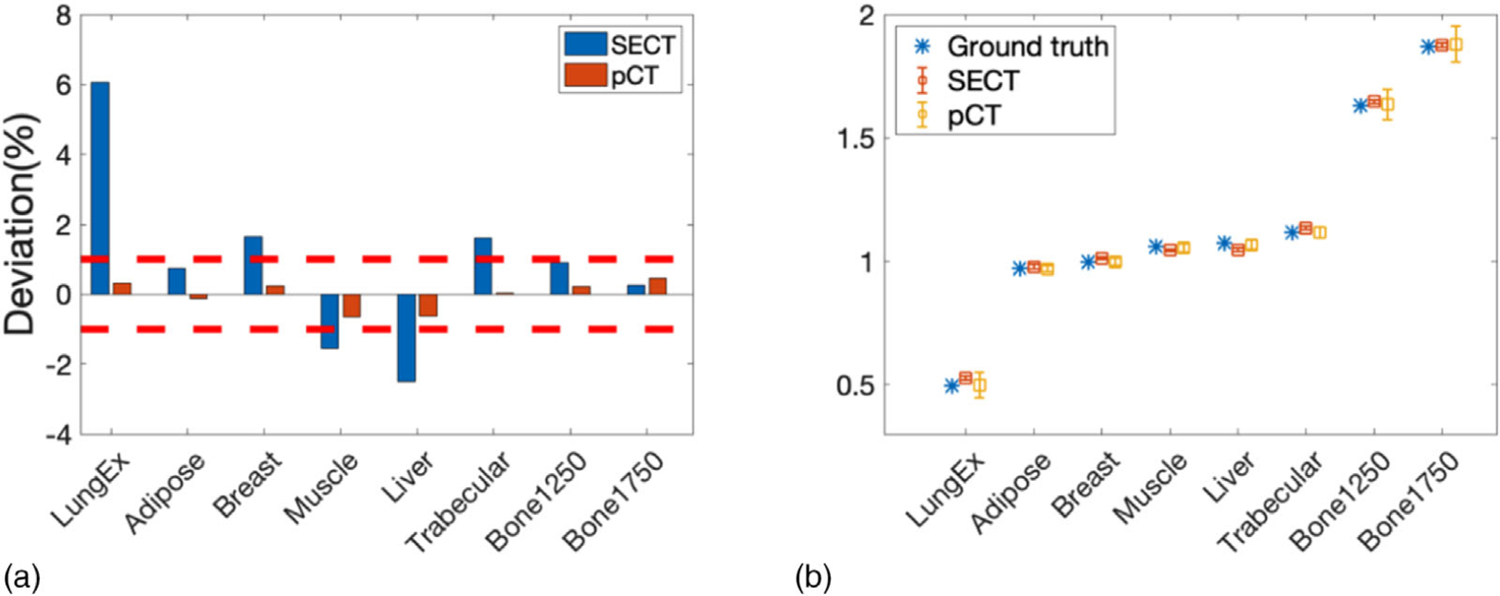
(a) Percentage deviation from the reference SPR at each insert calculated from the pCT and SECT approach. The two red dashed lines indicate 1% deviation. (b) Mean and STD of SPR of each insert calculated from the pCT and SECT approach compared with reference SPR