
FIGURE 6.
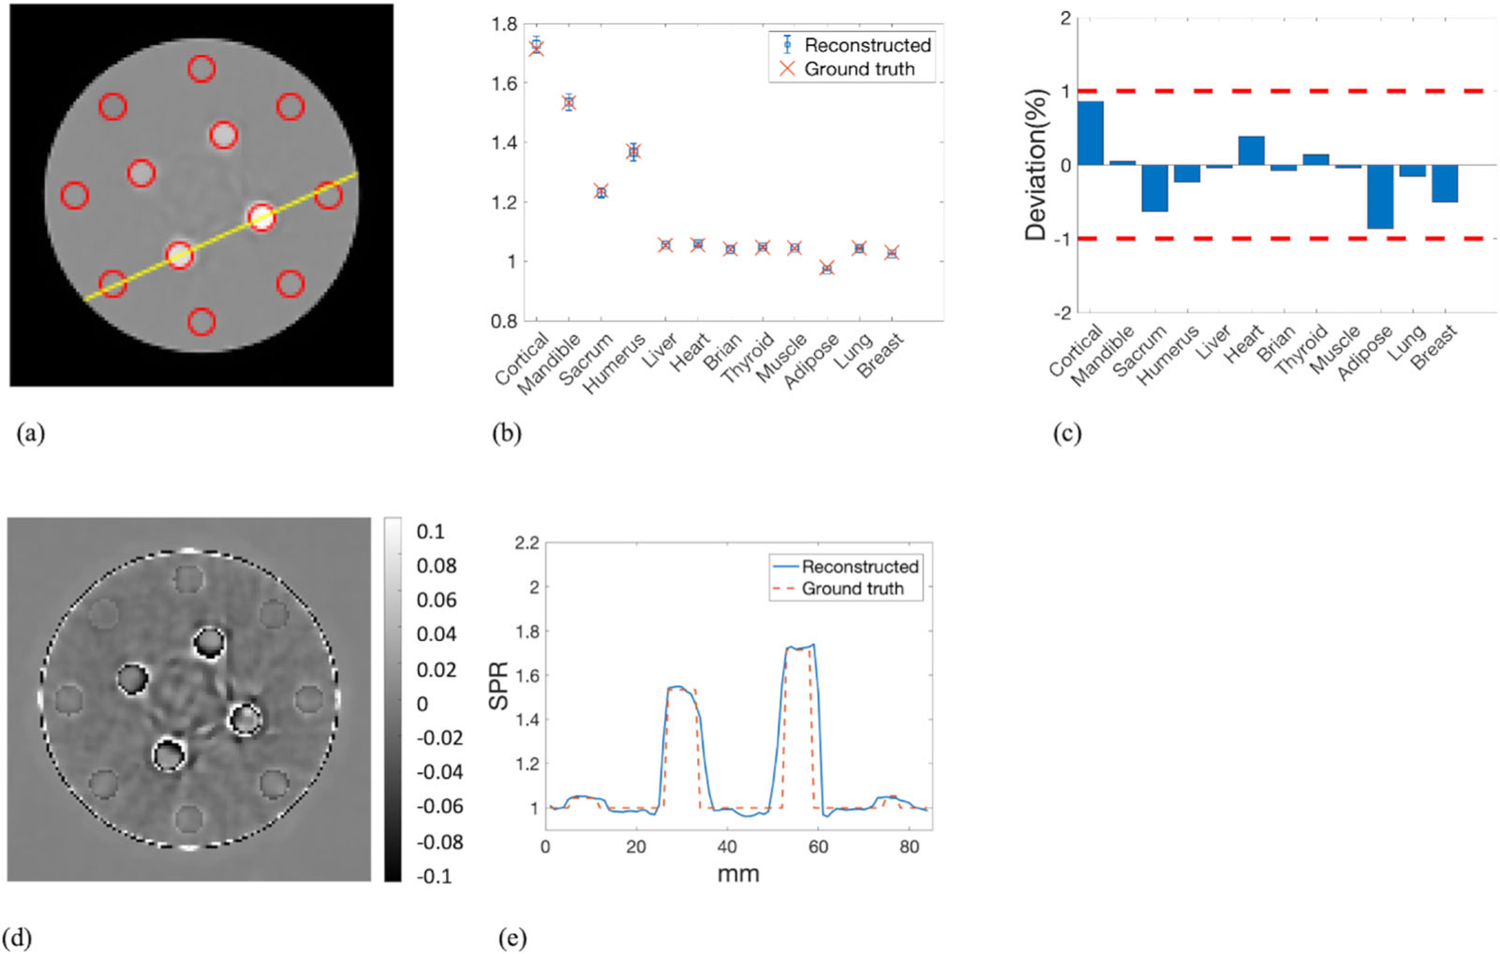
(a) ROIs of the inserts over which the mean and STD of the SPR were calculated. The yellow line indicated the line along which the profiles of reconstructed SPR and reference SPR were compared. (b) The mean value of the reconstructed SPR in each ROI with the associated error bar indicating the STD was plotted along with the reference values of SPR. (c) The deviations of the mean SPR in the ROIs from the ground truth. (d) Pixel-wise difference map between reconstructed SPR and reference SPR. (e) Profile comparison of reconstructed SPR and reference SPR along the line depicted in panel (a)