
FIGURE 9.
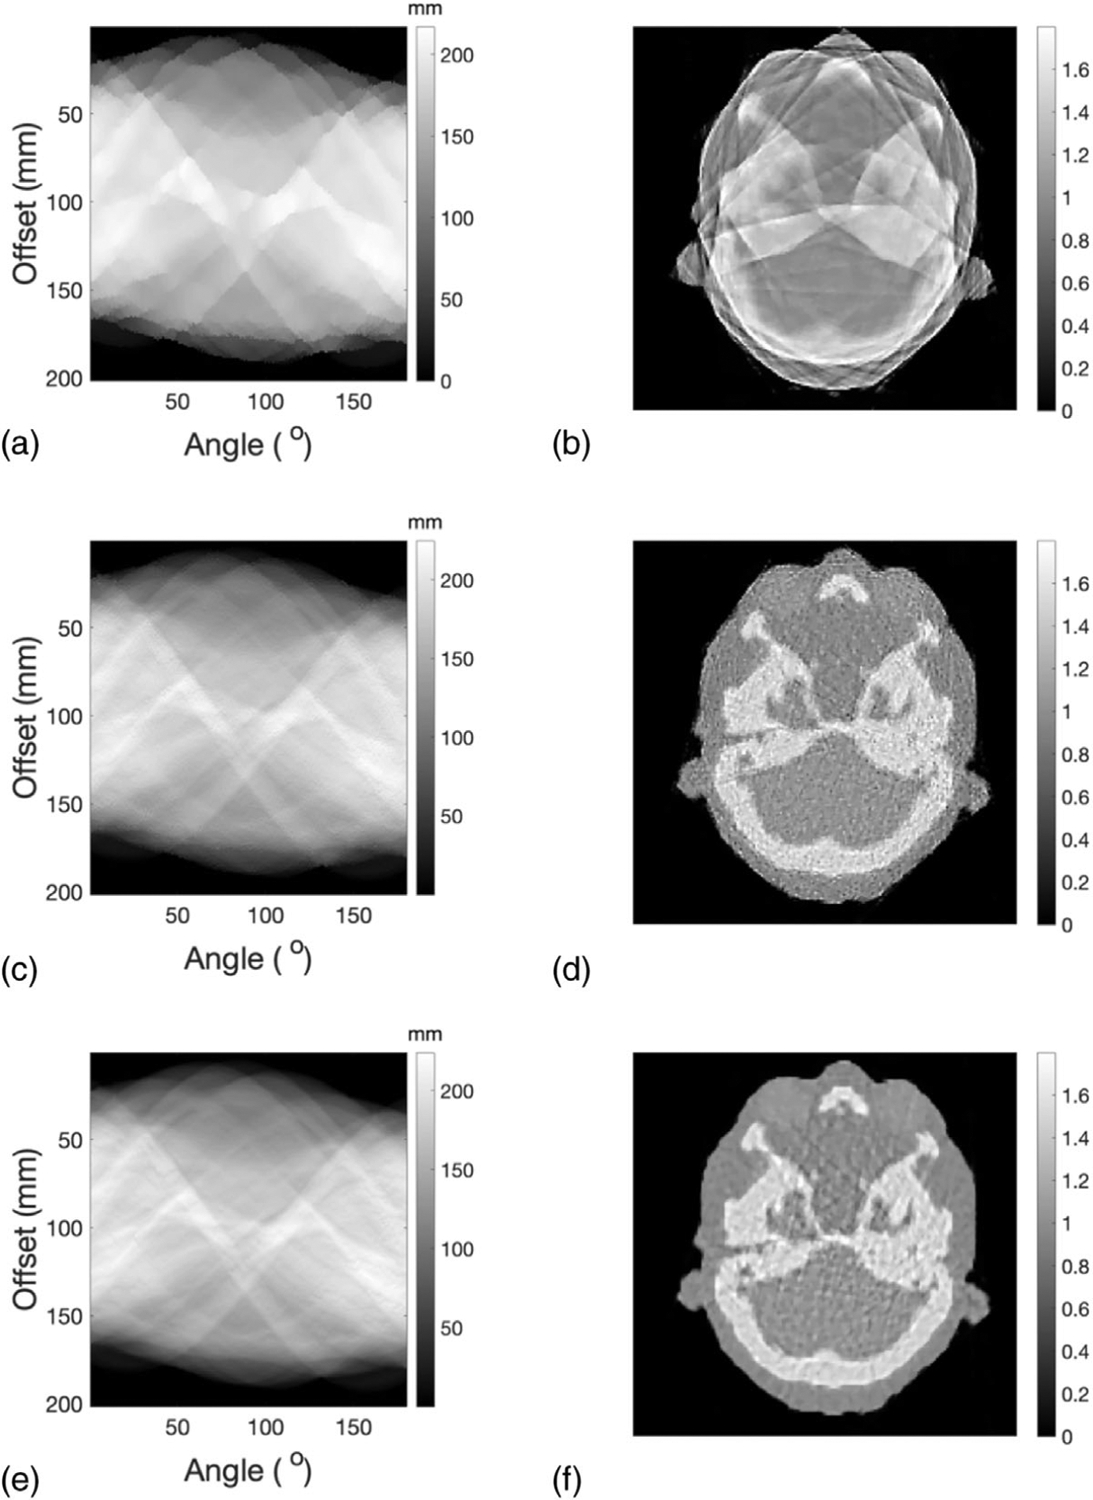
(a) Initial values of WEPL for a slice of adult phantom representing the head region. (b) SPR distribution reconstructed from the initial values of WEPL. (c) Optimized WEPL after the first iteration. (d) SPR distribution reconstructed from corrected WEPL after the first iteration. (e) Optimized WEPL and its corresponding (f) SPR distribution after the second iteration