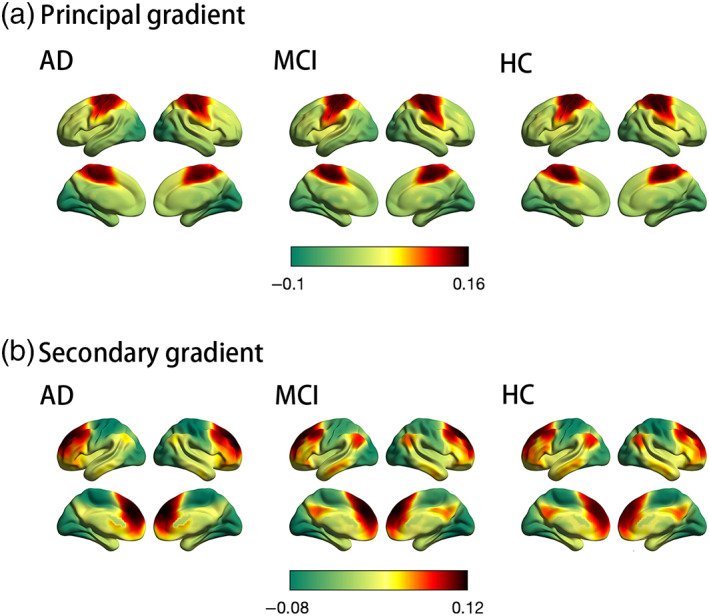
FIGURE 1.

Connectome gradient mapping in the Alzheimer's disease (AD), mild cognitive impairment (MCI), and healthy control (HC) groups. (a) and (b) show the principal and secondary gradient mapping results, respectively. The scale bar reflects z‐transformed gradient values derived from connectivity matrices using diffusion map embedding. The proximity of colors indicates the similarity in connectivity patterns across the cortex. (a) The principal gradient of connectivity in the AD, MCI, and HC groups peaks within primary sensory networks, separating somatomotor network regions (red) from visual network regions (green). (b) The secondary gradient shows a gradual axis of connectivity variations that placed low‐level sensory network regions (green) on the one end and high‐level default mode network regions (red) on the other end, with intermediary network regions in between
