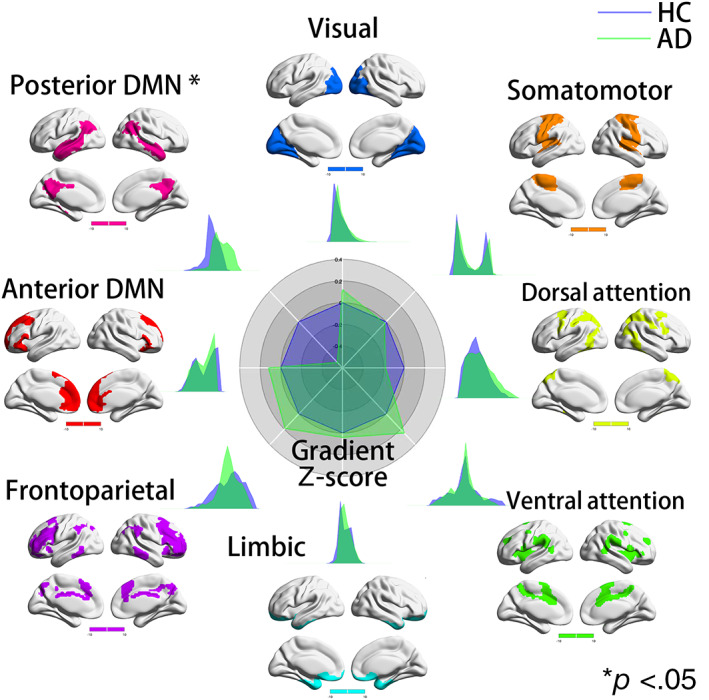
FIGURE 2.

Network‐level secondary gradient comparison between Alzheimer's disease (AD) and healthy control (HC) groups. The radar chart shows the gradient Z‐score (with respect to HCs) of the two groups. In the secondary gradient, compared to HCs, patients with AD exhibited significantly lower gradient values in the pDMN (Cohen's d = −0.53, t = −2.6399, p = .0097). There were no differences in gradient values between patients with AD and HCs in the remaining subnetworks. Each subnetwork's spatial location was anchored in the corresponding position, and Cohen's d was computed
