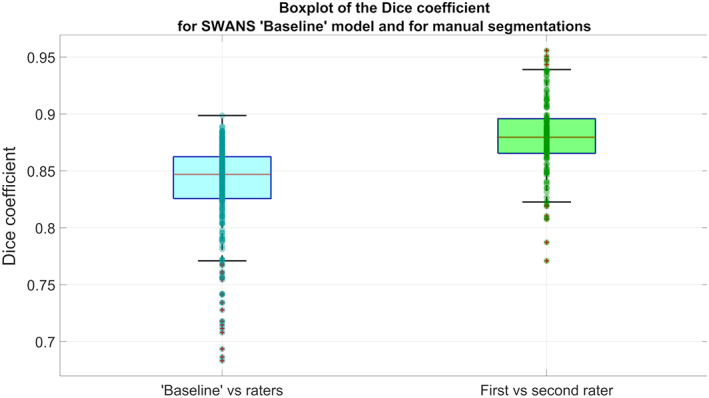
FIGURE 2.

Boxplots of Dice coefficients for the SWANS network with the “Baseline” model (using separately labels from rater 1 and 2 as ground truth) on the left and for the manual raters (comparing the raters with each other) on the right, using the whole dataset of 146 hippocampi
