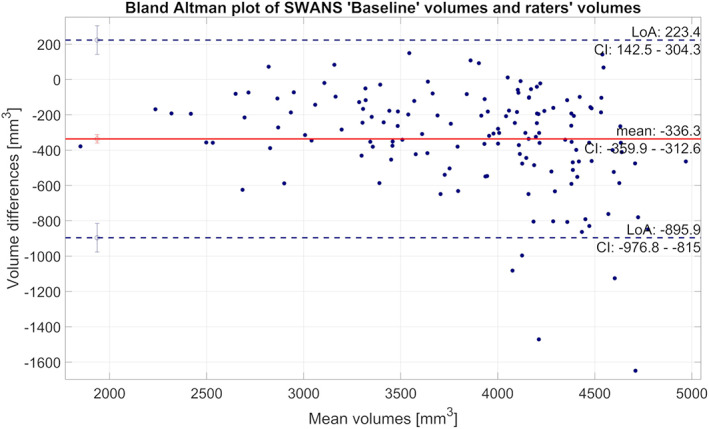
FIGURE 3.

Bland Altman plot comparing hippocampal volumes from the SWANS network with the “Baseline” model to the gold standard (the average of the two manual labels). Positive values indicate that hippocampal volumes from SWANS were larger than gold standard and vice versa
