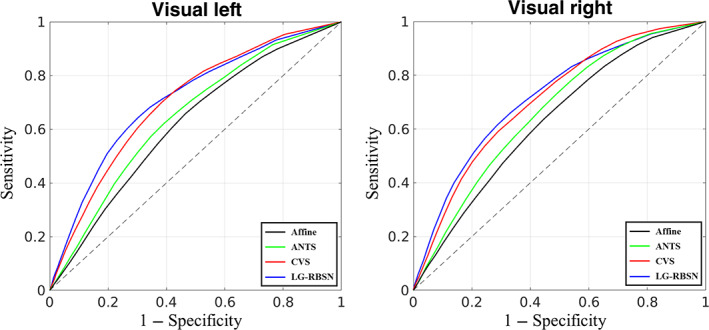
FIGURE 13.

ROC curve evaluating spatial normalization methods with visual task‐based fMRI group level t‐statistics activation map compared to FreeSurfer lateral‐occipital region (left: for stimulating left visual hemifield; right: for stimulating right visual hemifield). ANTs, advanced normalization tools; CVS, combined volumetric and surface registration; LG‐RBSN, landmark‐guided region‐based spatial normalization; ROC, receiver operating characteristic
