
FIGURE 2.
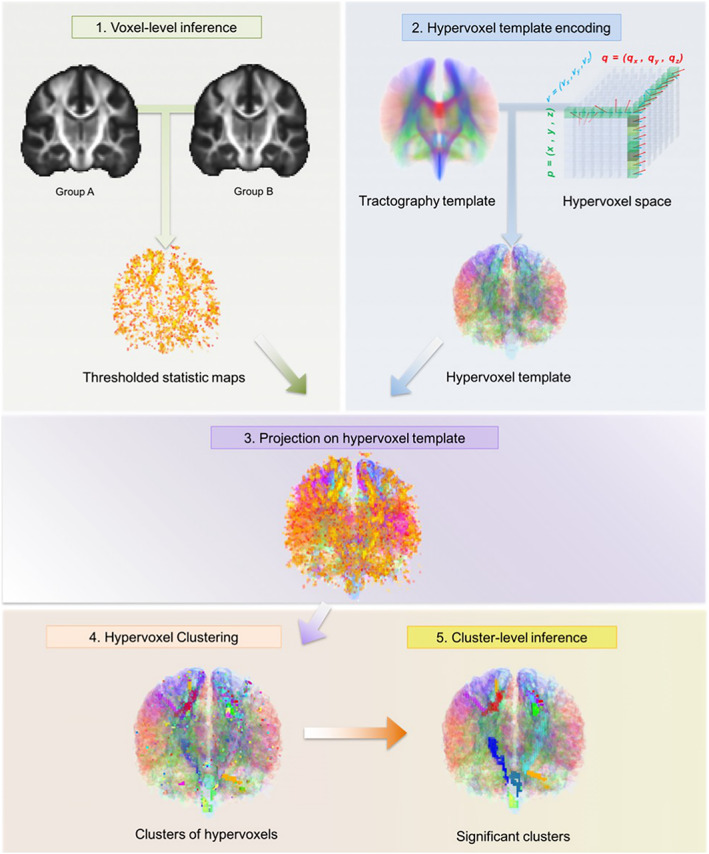
The TBCA analysis pipeline. After all images have been normalized to a common anatomical space, statistics maps are produced based on the voxel‐level analysis of the data; this is done by using a nonparametric approach based on a permutation test strategy (Winkler et al., 2014). The statistic maps are thresholded by a value of p = .01. Next, the significant voxel level statistic results are projected on a hypervoxel template. Finally, significant clusters of hypervoxels are identified. Figure from Luque Laguna (2019)