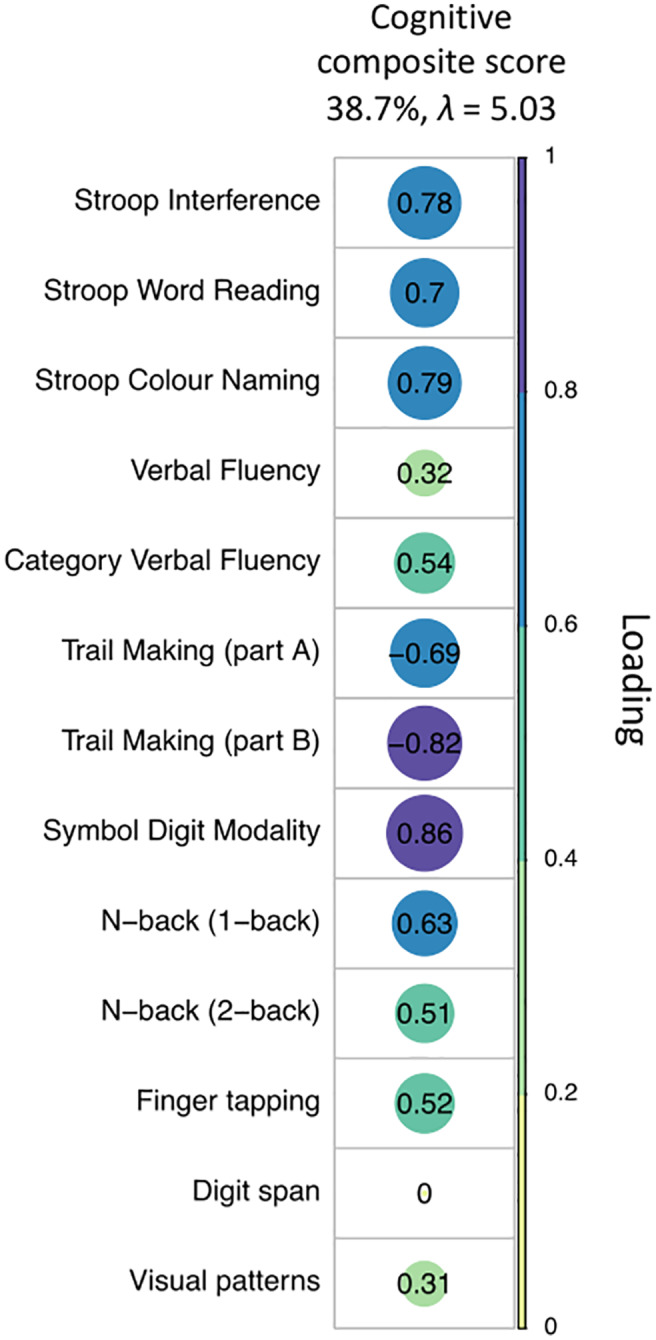
FIGURE 3.

PCA of the cognitive data with varimax rotation. Plot summarizing how each variable is accounted for in the extracted PC. The absolute correlation coefficient is plotted. Color intensity and the size of the circles are proportional to the loading. This PC accounted for 38.7% of the total variance and included measures from all test domains, except for the digit span. Four patients were excluded from the PCA because of missing data. The final sample size for the PCA was n = 21 patients
