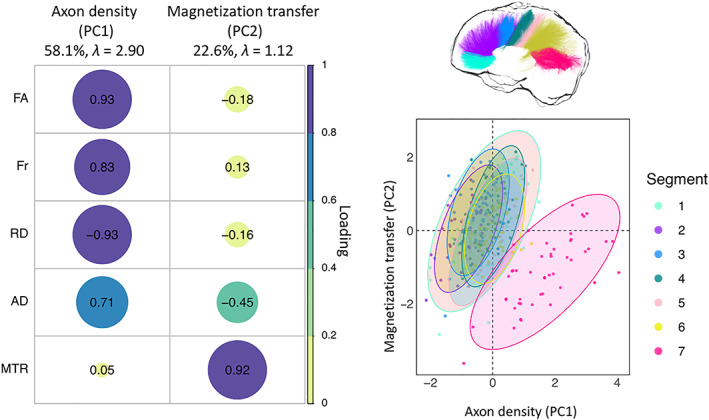
FIGURE 4.

PCA of the microstructure metrics with varimax rotation. Left: Plot summarizing how each variable is accounted for in every principal component. The absolute correlation coefficient is plotted. Color intensity and the size of the circles are proportional to the loading. The final sample size for the PCA was n = 25 for the HD group and n = 24 for the control group. Right: Segment clustering based on PC1 and PC2. The horizontal axis shows increasing restriction or hindrance perpendicular to the main axis of the bundles. The vertical axis represents an increase in MTR. Each point represents one subject. Concentration ellipsoids cover 95% confidence around the mean. Segment 7 appears to encompass most of the data variability
