

SUMMARY
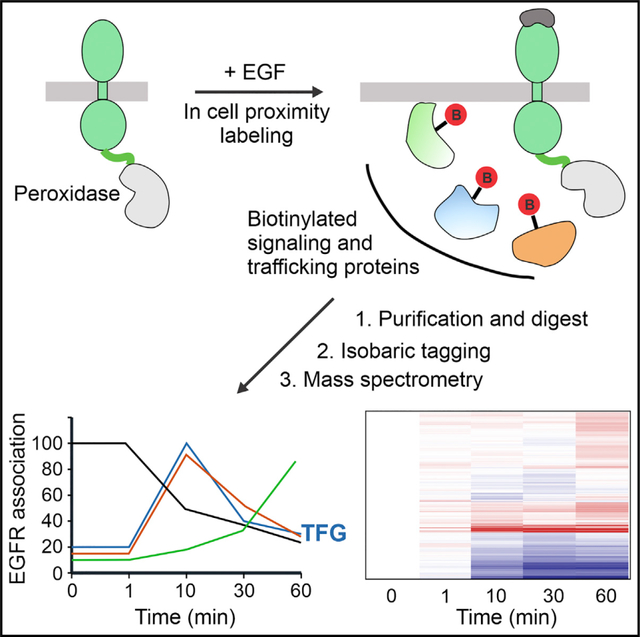
Ligand binding to the EGF receptor (EGFR) triggers multiple signal-transduction processes and promotes endocytosis of the receptor. The mechanisms of EGFR endocytosis and its cross-talk with signaling are poorly understood. Here, we combine peroxidase-catalyzed proximity labeling, isobaric peptide tagging, and quantitative mass spectrometry to define the dynamics of the proximity proteome of ligand-activated EGFR. Using this approach, we identify a network of signaling proteins, which remain associated with the receptor during its internalization and trafficking through the endosomal system. We show that Trk-fused gene (TFG), a protein known to function at the endoplasmic reticulum exit sites, is enriched in the proximity proteome of EGFR in early/sorting endosomes and localized in these endosomes and demonstrate that TFG regulates endosomal sorting of EGFR. This study provides a comprehensive resource of time-dependent nanoscale environment of EGFR, thus opening avenues to discovering new regulatory mechanisms of signaling and intracellular trafficking of receptor tyrosine kinases.
In brief
Perez Verdaguer et al. use time-resolved APEX labeling of the proximity proteome of EGFR upon ligand activation to provide comprehensive information about the dynamics of the EGFR-associated protein networks involved in receptor endocytosis and signaling.
Graphical Abstract
INTRODUCTION
Epidermal growth factor receptor (EGFR) belongs to a large family of receptor tyrosine kinases that control a broad range of cell activities, such as cell proliferation, survival, differentiation, motility, and metabolism. EGFR plays important roles in mammalian development and tissue homeostasis in adult organisms (Sibilia et al., 2007). Mutations and overexpression of EGFR often leading to its aberrant activity are associated with tumorigenesis and metastatic processes (Grandis and Sok, 2004). Ligand binding to EGFR triggers receptor dimerization, activation of the tyrosine kinase in its cytoplasmic domain, and phosphorylation of tyrosine residues in the receptor carboxy-terminal tail. Phosphotyrosine motifs serve as docking sites for downstream signaling proteins containing Src homology 2 (SH2) and phosphotyrosine-binding domains (Lemmon and Schlessinger, 2010). Ligand binding also results in rapid endocytosis through clathrin-dependent and -independent pathways (Sorkin and Goh, 2009). Internalized EGFR is capable of recycling back to the cell surface but is also targeted for lysosomal degradation leading to receptor down-regulation (Sorkin and Goh, 2009). Endocytic trafficking of EGFR is proposed to play an important role in the spatiotemporal regulation of EGFR signaling, and dysregulation of this trafficking is associated with cell transformation (Mellman and Yarden, 2013; Sigismund et al., 2021; von Zastrow and Sorkin, 2021). However, mechanisms of EGFR endocytic trafficking and its crosstalks with EGFR signaling are not well understood. In particular, whether EGFR triggers signaling after endocytosis from endosomes and whether such signaling is necessary for proper downstream outcomes are unclear.
Defining the dynamics of EGFR interactome in time and space is crucial for elucidation of the mechanisms of ligand-induced endocytosis of EGFR and how endocytosis regulates signaling. Numerous mass-spectrometry proteomic studies analyzed proteins co-immunoprecipitated with EGFR and proteins phosphorylated in cells upon EGFR activation (examples are Foerster et al., 2013; Francavilla et al., 2016; Tong et al., 2014). These studies generated one of the most extensive interactome and phosphosite databases for any signaling receptor. Moreover, compartment-specific interactome of EGFR was analyzed by identifying proteins co-precipitated with EGFR in various subcellular fractions in HeLa cells (Itzhak et al., 2016). However, all the above-mentioned studies analyzed samples either after detergent solubilization or cell homogenization, procedures that may disrupt transient protein-protein interactions. By contrast, techniques based on proximity labeling by biotin allow detection of proteins located within ~20-nm radius from the bait in the intact cell. In particular, highly efficient proximity labeling with engineered ascorbate peroxidase APEX2 (Lam et al., 2015) combined with quantitative mass spectrometry allows fine temporal resolution and has been used for a space- and time-resolved analysis of the interaction networks of agonist-activated G-protein coupled receptors (Lobingier et al., 2017; Paek et al., 2017).
In the present study, we generated cells stably expressing EGFR-APEX2 fusion protein and analyzed proximity proteome of EGFR-APEX2 during the first hour of its activation by EGF. The time-dependent changes in the abundance of various plasma membrane, endosome, and lysosome resident proteins in the proximity proteome were consistent with the movement of EGFR-APEX2 upon EGF stimulation from the cell surface to early and sorting endosomes and then to late endosomes and lysosomes. Analysis of EGFR-APEX2 proximity proteome revealed a network of proteins implicated in signal-transduction processes with time-dependent abundance profiles, which are similar to those of resident sorting-endosome proteins, suggesting localization of signaling proteins in EGFR-containing endosomes. Moreover, this analysis identified a putative component of the endosome Trk-fusion gene (TFG). TFG is a cytosolic protein that is located at the endoplasmic reticulum (ER) exit site (ERES) and is involved in COPII-mediated cargo transport from the ER to the ER-Golgi intermediate compartment (ERGIC) (Witte et al., 2011). To explore the finding of TFG in proximity to internalized EGFR, we demonstrated the localization of a fraction of TFG in early and sorting endosomes and showed that it regulates endosomal sorting of ligand-bound EGFR.
RESULTS AND DISCUSSION
Time-resolved proximity labeling defines the dynamics of EGFR interaction networks during ligand-induced internalization and post-endocytic traffic of the receptor
To analyze time-dependent changes in the proximity proteome of ligand-activated EGFR, we generated human colon carcinoma HCT116 and human embryonic kidney HEK293T cell lines that stably express EGFR fused at the C terminus with APEX2 (Lam et al., 2015) (Figures 1A and S1A). Western-blotting analysis showed that EGFR-APEX2 is expressed in HCT116 cells at a level that is ~1.1-fold higher than that of endogenous EGFR, whereas the expression level of EGFR-APEX2 in HEK293T cells is half of that of endogenous EGFR (Figure 1B). EGF caused robust phosphorylation of Tyr1068 in EGFR-APEX2, suggesting that the fusion protein is fully kinase active, although interestingly, this phosphorylation of EGFR-APEX2 was slightly elevated compared with untagged EGFR (Figures 1A and 1C). EGF also triggered strong activation of Akt and ERK1/2 signaling pathways (Figures 1A, S1B, and S1C) in both parental and transfected HCT116 and HEK293T cells, except that Akt was found to be constitutively activated in HEK293T cells. Because of high total levels of EGFR expression in HCT116/EGFR-APEX2 cells, saturability of the ligand-induced EGFR degradation process (Sorkin and Goh, 2009) resulted in a slower down-regulation of the EGFR/EGFR-APEX2 activity and, therefore, somewhat increased amplitude and duration of signaling in these cells compared with parental HCT116 (Figures 1A, S1B, and S1C). Expression of EGFR-APEX2 in HEK293T cells did not affect down-stream signaling (Figures 1A and S1C), although a trend of a slightly slower EGFR/EGFR-APEX2 down-regulation compared with that in parental cells was observed (Figure 1A). Importantly, the kinetics of 125I-EGF endocytosis was comparable in parental and EGFR-APEX2-expressing cells (Figure 1D). Overall, these experiments validated the use of two cell lines expressing high and low levels of EGFR, such as HCT116/EGFR-APEX2 and HEK293T/EGFR-APEX2 cells, as complementary experimental models for studying time-resolved proximity proteome of EGFR.
Figure 1. Characterization of cell lines expressing the EGFR-APEX2 fusion protein and the schematic representation of the proximity labeling experiment.

(A) Serum-starved parental HCT116, HCT116/EGFR-APEX2, parental HEK293T, and HEK293T/EGFR-APEX2 cells were stimulated with 100 ng/mL EGF for indicated times. The cells were lysed followed by probing lysates by western blotting with pY1068, total EGFR (rabbit polyclonal), pAkt, total Akt, pERK1/2, and total ERK1/2 antibodies. On the right, blots of EGFR from HEK293T lysates are shown at a 3-fold-higher intensity setting compared with corresponding blots on the left. All data are from the same blot from the representative experiment.
(B) Ratio of the amount of EGFR-APEX2 to that of untagged EGFR was calculated in EGF-unstimulated cells using blots exemplified in (A). Bar graphs represent mean values with SDs (n = 4).
(C) Ratios of pY1068 and pan-EGFR signals were quantitated for EGFR and EGFR-APEX2 in both HEK293T and HCT116 cells stimulated with EGF for 10 min and normalized to the same ratio quantitated for EGFR in corresponding parental cells stimulated with EGF for 10 min (all using blots exemplified in A). Bar graph represents mean values of normalized ratios with SDs (n = 4).
(D) Serum-starved parental HCT116, HCT116/EGFR-APEX2, parental HEK293T, and HEK293T/EGFR-APEX2 cells were stimulated with 100 ng/mL 125I-EGF for indicated times. The amount of surface and internalized radioactivity was measured, and the data are expressed as percentages of internalized to total cell-associated 125I-EGF. Mean values with SDs (n = 3) are shown. Error bars are not shown if they are smaller than markers.
(E) During 1-min H2O2 treatment of cells engineered to stably express EGFR fused at the carboxyl-terminus with APEX2, APEX2 catalyzes the transfer of biotin tyramide (BT) to the membrane-associated and cytosolic proteins surrounding EGFR-APEX2 within the radius of 20 nm. EGF binding activates EGFR-APEX2 and causes its endocytosis. H2O2 is added during the last minute of cell incubations with EGF, thus allowing time-dependent biotinylation of proteins proximal to EGFR-APEX2 before, during, and after endocytosis. Biotinylated proteins are pulled down by streptavidin pull-down, trypsin digested, TMT labeled, combined in a TMT experiment, fractionated into 6 fractions, and analyzed by mass spectrometry. Data analysis reveals the dynamics of relative abundances of proteins in the proximity to EGFR following EGF treatment.
Figure 1E illustrates the pipeline of a proximity labeling experiment in which serum-starved HCT116/EGFR-APEX2 or HEK293T/EGFR-APEX2 cells are preincubated with biotinyl-tyramide for 1 h and stimulated with 100 ng/mL EGF. Biotinylation of cytoplasm-exposed protein regions located in the proximity to APEX2 (~20-nm radius) is catalyzed by H2O2 during the last 1 min of cell incubation with EGF. Control experiments demonstrated that H2O2 treatment slightly increased EGF-induced phosphorylation of down-stream kinases in HCT116 cells (Figure S1D), which may be attributed to an inhibitory effect of H2O2 on phosphatases during cell solubilization (Rao and Clayton, 2002; Reynolds et al., 2003). After cell lysis and streptavidin-biotin pull-down, precipitated biotinylated proteins are digested by LysC/trypsin and labeled using tandem mass tag (TMT) 9–11plex reagents, and samples were fractionated into six fractions and analyzed by mass spectrometry (Figure 1E).
To track time-dependent proximity proteome of EGFR-APEX2, serum-starved HCT116 cells were left untreated or incubated with EGF for 1, 10, 30, and 60 min, and proximity labeling was conducted as depicted in Figures 1E and S2A. Samples with no H2O2 treatment were included as negative control in TMT experiments (Figure S2A). Abundance of all quantified proteins in H2O2-untreated cells was substantially lower than in H2O2-treated cells, and only ~3%–6% of all proteins quantified had comparable abundances in H2O2-treated and -untreated samples (Figures S2B–S2D). Such proteins were mostly of nuclear, ribosome, and mitochondria origin, and all are considered to be non-specific background from streptavidin-biotin pull-downs (Table S1). EGFR abundance did not significantly change during 1-hr EGF treatment (Figure S2E), in agreement with western-blotting analysis of EGFR/EGFR-APEX2 in HCT116/EGFR-APEX2 cells (Figure 1A).
1,886 proteins were quantified in all three independent experiments (Table S2). A heatmap of these proteins showed that proteins had distinct time-dependent proximity to EGFR-APEX2 after EGF treatment (Figure 2A). The quantified proteins were divided into three groups based on log2(fold change(60 min/control)) (Figure 2B). Proximity to EGFR-APEX2 of proteins in group 2 did not significantly change after cell stimulation with EGF. Proteins in group 1 displayed decreased proximity to EGFR-APEX2, while proteins in group 3 had increased proximity to EGFR-APEX2, after 60-min EGF treatment (Figure 2B). Gene Ontology analysis showed that proteins in group 1 were enriched in plasma-membrane-related Gene Ontology categories, while proteins in group 3 were enriched in endosome-related Gene Ontology categories (Figures 2C and 2D). The dynamics of the proximity proteome is consistent with redistribution of ligand-bound EGFR-APEX2 from the plasma membrane to early and then late endosomes (Chinkers et al., 1979; Haigler et al., 1979; reviewed in Sorkin and Goh, 2009). Examples of proteins in different cellular compartments are presented in Figure 2E. The relative intensity of a resident plasma membrane protein lipolysis-stimulated lipoprotein receptor (LSR), ERBB2, a member of EGFR receptor tyrosine-kinase subfamily and a heterodimerization partner of EGFR, and small GTPase HRAS, a downstream signaling effector of EGFR, decreased ~2 times after EGF stimulation for 10 min (Figure 2E). The decrease concurs with the internalization impairment of ErbB2 (Baulida et al., 1996) and the predominant localization of endogenous HRAS in the plasma membrane (Pinilla-Macua et al., 2016). By contrast, early-endosome-associated antigen 1 (EEA1) and HGS, a hepatocyte growth factor-regulated tyrosine kinase substrate (alternative common protein name is HRS) (Komada and Kitamura, 1995), which are associated with early and sorting endosomes (Wenzel et al., 2018), had increased proximity to ligand-activated EGFR-APEX2 with the maximum abundance at a 10-min time point (Figure 2E). Several resident-sorting endosome proteins, such as STAM, STAM2, PTPN23, VPS37A, and USP8, were in the same trend as HGS (Table S2. The interactive viewer is available at https://wren.hms.harvard.edu/egfr/. On the other hand, proteins known to reside in late endosomes and lysosomes, such as LAMP1, LAMTOR1, and VTI1B, were found to be enriched in close proximity to EGFR-APEX2 after 30–60 min of EGF stimulation (Figure 2E). Together, the data in Figure 2 demonstrate that the dynamics of time-resolved proximity proteome of EGFR-APEX2 recapitulate typical dynamics of ligand-induced endocytosis and post-endocytic trafficking of the receptor through the endolysosomal compartments and provide comprehensive information about compartment-dependent changes in the receptor-proximal protein networks.
Figure 2. Time course of relative abundances of EGFR-APEX2 proximal proteins following EGF stimulation of HCT116/EGFR-APEX2 cells.

(A) Heatmap of proteins quantified in APEX2 experiments with HCT116 cells designed as shown in Figure S2A. 1,886 proteins with a summed signal-to-noise greater than 100 and quantified in all three independent TMT experiments are shown. Average of protein abundance in biological replicates across three TMT experiments performed independently were used for plotting.
(B) Proteins were divided into 3 groups based on the log2(fold change (60 min/control)).
(C and D) Gene Ontology analysis was conducted with proteins from groups 1 and 3, respectively.
(E) Examples of time-dependent relative abundances in EGFR-APEX2 proximity of plasma membrane, early/sorting endosome, and late endosome/lysosome proteins following EGF stimulation. Data points are mean values from 3 independent experiments.
To further dissect the protein networks in early endocytosis, we performed proximity labeling experiments with HCT116 and HEK293T cells stimulated or not with 100 ng/mL EGF for 5 min (Figure 3A). Proteins with more than 2-fold increase and a Benjamini-Hochberg-corrected p value < 0.05 after EGF simulation were highlighted in red in HCT116 (Figure 3B) and HEK293T (Figure 3C) cells. We quantified 1,206 proteins overlapping in both cell lines (Figures 3A–3C and S3A; Tables S3 and S4). As in Figure 2, both proximity proteomes were divided into 3 groups based on protein enrichment in EGF-stimulated over unstimulated cells (Figures S3B and S3C). Proteins that were significantly enriched in stimulated HCT116 and HEK293T cells were highly correlated (r = 0.67) (Figure S3D). Gene Ontology analysis suggested three major functional groups of EGFR proximal proteins enriched in EGF-stimulated cells: (1) proteins that are involved in clathrin-mediated endocytosis, (2) proteins that are part of the general endosomal-sorting machinery, and (3) proteins that are involved in signal-transduction processes (Figures 3 and S3E; Table S5). The presence of clathrin-associated machinery suggests substantial contribution of clathrin-mediated endocytosis in EGFR-APEX2 internalization in both cell lines, whereas enrichment of sorting-endosome proteins indicates that a significant fraction of EGFR-APEX2 reaches sorting endosomes after 5-min EGF stimulation. Examples of proteins enriched in the third, “signaling” group are phosphotyrosine-binding adaptors, such as GRB2 and SHC1, and SH2-domain-containing enzymes, such as RASA1 (GTPase-activating protein of RAS) and phospholipase γ1 (PLCG1), all previously shown or proposed to remain associated with EGFR during endocytosis and in endosomes (reviewed in Sorkin and Von Zastrow, 2002) (Figures 3B and 3C). Presence of those and other known EGFR interactors in proximity proteomes of cells with high (HCT116) and low (HEK293T) receptor levels indicates that EGFR overexpression did not qualitatively affect the observed EGFR interactome. Importantly, proximity labeling suggested the presence in early/late endosomes of several other signaling proteins that, to our knowledge, are not known to be directly associated with EGFR or enriched in endosomes. The list of such proteins includes adaptors like NCK1/2, CRK, CRKL, GRB2-associated and regulator of MAPK protein 1 (GAREM), non-receptor tyrosine kinases such as CSK (kinase upstream of Src family kinases), and cytoskeleton-regulating proteins like WASL (neural Wiskott-Aldrich syndrome protein [N-WASP]) that promotes actin polymerization (Figures 3B and 3C; Table S5). Analysis of time-dependent abundance profiles for proteins coenriched with HGS and other sorting-endosome proteins in experiments described in Figure 2 further expands the network of signaling proteins that remain proximal to EGFR during endocytosis and in endosomes with PIK3R2 and PIK3RCA/B (regulatory and catalytic subunits of phosphotidyl-inositol-3-kinase [PI3K]), adaptor/scaffold proteins such as SPRY4 and SH3KBP1, and a PDZ domain protein INADL (see https://wren.hms.harvard.edu/egfr/). While the precise roles of many of these signaling proteins in EGFR-containing endosomes need to be further investigated, the data in Figures 2 and 3 suggest that multiple signaling pathways can be triggered from endosomes containing EGF-activated EGFR. Alternatively, co-internalization of signaling effectors with EGFR may serve to terminate their signaling from the plasma membrane as part of negative feedback regulatory mechanisms.
Figure 3. Enrichment of endosomal and signaling proteins in EGFR proximal proteome upon 5-min EGF stimulation.

(A) Schematics of the proximity labeling TMTplex10 experiment of EGFR in HCT116 and HEK293T cells. Serum-starved cells were either untreated (control) or treated with 100 ng/mL EGF for 5 min and used to analyze the proximal proteins. Each replicate corresponding to a TMT channel is an individual cell culture plate treated with EGF independently.
(B and C) Volcano plots of quantified proteins in EGFR-APEX2 experiments in HCT116 (B) and HEK293T (C) cells. Proteins with greater than 2-fold change in relative abundance after EGF treatment are highlighted in red. Bar graphs on the right show mean intensity values of the abundance of TFG in EGFR-APEX2 proximity.
TFG is enriched in the proximity proteome of endosomal EGFR-APEX2
Most proteins that were enriched in the proximity proteome of internalized EGFR (Figures 2 and 3) have an established or a putative function either in endocytic traffic or intracellular signaling. Interestingly, TFG protein was found in the EGFR-APEX2 proximity proteome with the maximum abundance at 10 min of EGF stimulation (Figure 2E). The time-dependent enrichment profile of TFG was virtually identical to that of HGS (Figure 2E) and other proteins of sorting endosomes, such as STAM, STAM2, and PTPN23 in HCT116 cells (Table S2; https://wren.hms.harvard.edu/egfr/). Robust enrichment of TFG was observed in both HCT116 and HEK293T cells stimulated with EGF for 5 min (Figures 3B and 3C). Furthermore, time course of relative protein abundances during the first 10 min after EGF stimulation in TMTplex11 experiments (Figure 4A) demonstrated a similar distribution into three groups in both cell lines (Figure S4) as well as stimulation- and time-dependent enrichment of TFG in the proximity of EGFR (Figures 4B and 4C; Tables S6 and S7). The maximum of TFG enrichment in EGFR proximity proteome was reached earlier in HEK293T cells, presumably due to its substantially lower levels of EGFR-APEX2 and therefore faster endocytosis in these cells than in HSC116 cells (Figures 4B and 4C). Altogether, proximity labeling experiments presented in Figures 2, 3, and 4 suggest that TFG could be an additional component of sorting endosomes containing EGFR. Previous studies showed that TFG is a polymeric scaffold located at the interface between the ERES and the ERGIC and proposed that TFG is involved in uncoating of COPII vesicles and their delivery to the ERGIC-target membrane (Johnson et al., 2015; Witte et al., 2011). However, relative abundances of ERES proteins Sec13, Sec16, and Sec31, all proposed to interact with TFG (Hanna et al., 2017; Huttlin et al., 2021; Witte et al., 2011) in EGFR-APEX2 proximity proteome, did not significantly change upon EGF stimulation (Figures 4B and 4C; Table S2; https://wren.hms.harvard.edu/egfr/), indicating that these proteins are not enriched in the proximity of endosomal EGFR-APEX2. Therefore, detection of TFG in the proximity to the cytosolic domain of endosomal EGFR is indicative of ERES-independent localization and function of TFG, which motivated us to focus on the microscopic examination of TFG localization in the cell and its endosomal function.
Figure 4. Time-dependent enrichment of TFG in the proximity of EGF-activated EGFR-APEX2 and co-localization of TFG with internalized EGF-Rh.

(A) Schematics of the proximity labeling TMTplex11 experiment in HCT116 and HEK293T cells. Serum-starved cells were either untreated (control) or treated with 100 ng/mL EGF for 2–10 min to analyze the proximal proteins during receptor activation and internalization. Biological replicates (individually grown cell cultures) were included except for 10 min treatment.
(B and C) Time course of the relative intensity of TGF compared with LSR (plasma membrane) and Sec13 (ERES) proximal to EGFR-APEX2 in HCT116 (B) and HEK293T (C) cells stimulated with EGF in the experiment described in (A).
(D–F) HCT116/EGFR-APEX2 (D), HSC3 (E), and HeLa/FAP-EGFR (F) cells were stimulated with 10 ng/mL EGF-Rh for 15 min and fixed and labeled with TFG antibodies. Three-dimensional (3D) confocal images were acquired through 561- (magenta, EGF-Rh) and 488-nm (green, TFG) channels.
(G) Quantification of the fraction of TFG co-localized with EGF-Rh from images exemplified in (E) and (F). Bar graph represents mean values with SDs (n of 13–32 fields of view [FOVs] from 2 to 5 independent experiments).
(H) HSC3 cells transiently expressing GFP-TFG were stimulated with 10 ng/mL EGF-Rh for 15 min. 3D confocal images were acquired through 561- (magenta, EGF-Rh) and 488-nm (Green, GFP-TFG) channels.
(I) Quantification of the fraction of EGF-Rh co-localized with GFP-TFG from images exemplified in (H). Bar graph represents mean values with SDs (n = 11 individual cells) from 2 independent experiments. All images are single sections through the middle of the cell of representative 3D images.
Insets in (D)–(F) represent enlargements of the regions indicated by rectangles. Arrows indicate examples of co-localization. Asterisks show positions of nuclei. Scale bars, 10 μm in full images and 5 μm in insets.
TFG partially co-localizes with internalized ligand-bound EGFR
Immunofluorescence microscopy of HCT116/EGFR-APEX2 cells, which were stimulated with EGF-rhodamine (EGF-Rh) conjugate for 15 min and stained with the TFG antibody, revealed a punctate distribution pattern of endogenous TFG (Figure 4D). A fraction of TFG puncta co-localized with internalized EGF-Rh (Figure 4D), thus supporting the observation of TFG proximity to endosomal EGFR discovered in EGFR-APEX2 labeling experiments. To further characterize endosomal localization and function of TFG in cells expressing endogenous EGFR, we used human squamous cell carcinoma HSC3 cells, which are growth dependent on EGFR (Kudo et al., 2003) and which we have previously characterized with respect to EGFR endocytosis and signaling in vitro and in vivo (Pinilla-Macua et al., 2017). Additionally, HeLa cells expressing endogenous EGFR tagged with fluorogen-activating protein (FAP) by gene editing, which we thoroughly characterized as a model system allowing quantitative analysis of unliganded EGFR trafficking, were used (Larsen et al., 2019). As shown in Figures 4E–4G, approximately 8%–10% of cellular TFG was co-localized with internalized EGF-Rh in both these cell lines. The extent of TFG co-localization with EGF-Rh may have been, however, underestimated because of poor fixability of EGF-Rh (lacking free amino groups) leading to its release during cell fixation and permeabilization. To obviate this caveat, live-cell imaging of GFP-tagged TFG (GFP-TFG) transiently expressed in HSC3 cells stimulated with EGF-Rh was performed. In these experiments, GFP-TFG co-localization with EGF-Rh in endosomes was more robust and readily detectable than in immunofluorescence labeling experiments (Figure 4H). Because of a variable expression level of GFP-TFG in transient transfection experiments, quantification of a fraction of GFP-TFG co-localized with EGF-Rh is not informative. Instead, a fraction of internalized EGF-Rh co-localized with GFP-TFG was quantitated. This fraction was on average ~20% of endosomal EGF-Rh (Figure 4I). The extent of co-localization varied from cell to cell but did not correlate with the amount of GFP-TFG.
To compare the extent of TFG localization at the ERES and in endosomes, HSC3 cells were co-stained with antibodies to TFG and Sec31, a component of the COPII coat that is involved in the ER protein export at the ERES (Peotter et al., 2019). Figure 5A shows that, in agreement with previous studies (Hanna et al., 2017; Johnson et al., 2015), most bright TFG spots co-localized with Sec31, although a considerable number of TFG spots, which were typically dimmer, did not localize at the ERES (negative for Sec31). Upon incubation of HSC3 cells with 10 ng/mL EGF-Rh, a fraction of TFG puncta became co-localized with EGF-Rh-containing endosomes (Figure 5B), and the extent of TFG:Sec31 co-localization showed a slight transient decline (Figure 5C). Visual analysis of TFG and EGF-Rh fluorescence suggested that EGF-Rh is mostly co-localized with Sec31-negative, dim TFG puncta (Figure 5B). Nevertheless, a small fraction of EGF-Rh endosomes was seen co-localized with or juxtaposed to bright Sec31-positive TFG puncta (Figure 5B). In summary, the data in Figures 4 and 5A–5C show that whereas, consistently with previous studies, the bulk of TFG is located at the ERES, a smaller but substantial pool of TFG is either associated with EGFR-containing endosomal compartments or located in close proximity to endosome membranes.
Figure 5. Co-localization of TFG with ERES, internalized EGF-Rh, and endosomal markers.

HCS3 cells were untreated or treated with 10 ng/mL EGF-Rh for 15 min or 60 min and fixed. Sixty-min images are not shown.
(A and B) Staining with TFG and Sec31 antibodies. 3D confocal images were acquired through 640- (cyan, Sec31), 561- (magenta, EGF-Rh), and 488-nm (green, TFG) channels. Arrows point at examples of TFG localization with Sec31, and arrowheads point at TFG puncta that is not co-localized with Sec31. Circles indicate examples of co-localization of TFG with EGF-Rh outside of the ERES.
(C) Quantification of TFG-Sec31 co-localization from images exemplified in (A) and (B). Bar graph represents mean values with SDs (n of 20–37 FOVs from 3 to 6 independent experiments). Kruskal-Wallis test. Dunn’s multiple comparisons test.
(D and E) Staining with TFG and EEA1 antibodies. 3D confocal images were acquired through 640- (cyan, EEA.1), 561- (magenta, EGF-Rh), and 488-nm (green, TFG) channels. Arrows point at examples of TFG localization with EEA1. Circles indicate colocalization of TFG, EEA1, and EGF-Rh.
(F) Quantification of TFG-EEA1 co-localization from images exemplified in (D) and (E). Bar graph represents mean values with SDs (n of 30–38 FOVs from 4 to 6 independent experiments). Kruskal-Wallis test. Dunn’s multiple comparisons test.
(G and H) Staining with TFG and HGS antibodies. 3D confocal images were acquired through 640- (cyan, HGS), 561- (magenta, EGF-Rh), and 488-nm (green, TFG) channels. Arrows point at examples of TFG co-localization with HGS. Circles indicate co-localization of TFG, HGS, and EGF-Rh.
(I) Quantification of TFG-HGS co-localization from images exemplified in (G) and (H). Bar graph represents mean values with SDs (n of 31–32 FOVs from 4 independent experiments). One-way ANOVA. Tukey’s multiple comparison test.
(J and K) Quantification of co-localization of EGF-Rh with EEA1 (J) and HGS (K) from images exemplified in (D) and (E) and (G) and (H). Bar graph represents mean values with SDs (n of 31–32 FOVs from 4 independent experiments). p values were calculated using unpaired t test. All images are single sections through the middle of the cell of representative 3D images.
Insets in (A), (B), (D), (E), (G), and (H) represent enlargements of the regions indicated by rectangles. Asterisks show positions of nuclei. Scale bars, 10 μm in full images and 5 μm in insets.
Fraction of TFG in early/sorting endosomes is increased by EGF
To address whether TFG targeting to early/sorting endosomes is EGF dependent, HSC3 cells untreated and treated with EGF-Rh were co-stained with the TFG and EEA1 (early/sorting endosomes), HGS (sorting endosomes), or Rab5 (early endosomes) antibodies. TFG was partially co-localized with EEA1-positive endosomes in both untreated and stimulated cells (Figures 5D and 5E). Quantifications revealed an ~1.5-fold increase in the extent of TFG co-localization with EEA1 after 15 min of EGF-Rh stimulation followed by the decrease in this co-localization after 60 min, down to the extent measured in untreated cells (Figure 5F). A similar trend of increased co-localization of TFG with HGS (Figures 5G–5I) in EGF-Rh-stimulated cells was also observed. The fraction of TFG co-localized with Rab5 immunofluorescence was smaller (<5%) than that co-localized with EEA1 (20%–30%) or HRS (15%–20%) due to less efficient antibody labeling of Rab5; however, an EGF-dependent increase of TFG co-localization with Rab5 was also observed (Figures S5A–S5D). In all experiments, internalized EGF-Rh was highly co-localized with markers of early/sorting endosomes (Figures 5J, 5K, and S5E). On the other hand, accumulation of ligand-free EGFR in endosomes triggered by activation of stress-induced p38-MAPK with 100 nM Anisomycin in HSC3 cells did not increase co-localization of TFG and EEA1, even though a fraction of TFG was present in EGFR-containing endosomes (Figures S5F–S5H). These data imply that the mere presence of EGFR in endosomes is not sufficient to increase TFG-EEA1 co-localization. Collectively, Figures 5 and S5 demonstrate that TFG is constitutively associated with early/sorting endosomes and that ligand activation of EGFR enhances this association, possibly, at a stage of the endosome maturation process past the stage of early endosomes at which unliganded EGFRs are accumulated upon p38/MAPK activation. It should be noted that visual inspection of individual examples of TFG localization in endosomes showed that shapes of the puncta labeled with EGF-Rh or endosomal markers, and shapes of an overlapping TFG-labeled puncta, are often not the same. This may be due to localization of TFG, EGF-Rh:EGFR complexes, and endosomal markers in different subdomains of endosomes, such as, for example, intralumenal vesicles (possible location of EGF-Rh) and so called Rab5-EEA1 and HGS subdomains (Raiborg et al., 2006). Alternatively, a fraction of TFG may be not directly associated with endosomes but located in ER membranes in close proximity to endosomal membranes (<20 nm), which would result in an overlap of corresponding fluorescence signals that is not resolved by confocal microscopy and is therefore scored as co-localization.
TFG knockdown regulates endosomal sorting of EGF:EGFR complexes and causes enlargement of endosomes
To begin an investigation of the TFG function in endosomes and EGFR endocytic trafficking, we examined effects of small interfering RNA (siRNA) knockdown of TFG on EGFR internalization, degradation, and recycling using radiolabeled EGF (125I-EGF) in HSC3 cells. Previously validated 3’ UTR (untranslated region) targeting siRNA duplex (siTFG-1) (Johnson et al., 2015) and SMARTPool siRNA (siTFG-2) were utilized, which resulted in TFG protein depletion by ~88% and ~95%, respectively (Figure 6A). Both siRNAs did not affect the amount of 125I-EGF internalized during cell incubation with the labeled ligand for 15 min (Figure 6B). To determine the effects of TFG knockdown on the endosomal sorting of EGF:EGFR complexes, the 125I-EGF recycling/degradation assay depicted in Figure 6C was employed (Sorkin and Duex, 2010). Briefly, in this assay, the cells are allowed to internalize 125I-EGF for 15 min, and non-internalized 125I-EGF is removed from the cell surface at 4°C (125I-EGF-loaded cells), which is followed by the chase incubation of loaded cells at 37°C. During this chase incubation, a fraction of internalized 125I-EGF:receptor complexes is sorted to late endosomes and lysosomes, where 125I-EGF is proteolyzed to low molecular weight 125I-labeled products that rapidly diffuse out into the extracellular medium (Sorkin and Duex, 2010). At the same time, a fraction of internalized 125I-EGF-receptor complexes are recycled back to the cell surface, where 125I-EGF is readily released into medium or re-internalized. Because TFG knockdown does not affect 125I-EGF internalization rates, the amount of surface-bound 125I-EGF and intact 125I-EGF in the medium at the end of the chase incubation were used to compare recycling of 125I-EGF:receptor complexes in control and TFG-depleted cells. Recycling of 125I-EGF-receptor complexes was evident after a 15-min chase incubation by the reappearance of 125I-EGF at the cell surface and in the medium, while 125I-EGF degradative products were not detected (Figure 6D). Although a trend of increased intact (recycled) 125I-EGF in the medium of TFG-depleted cells was observed after a 15-min chase, it was not statistically significant (Figure 6D). By contrast, degradation of 125I-EGF was evident after a 2-h chase, and both siTFG-1 and siTFG-2 significantly reduced the fraction of degraded 125I-EGF, while they increased the fraction of recycled (surface and medium intact) 125I-EGF (Figure 6D). The effects of siTFG-1 were slightly less pronounced, presumably due to a less complete depletion of TFG. Together, the data presented in Figures 6C and 6D demonstrate that TFG depletion has a regulatory role in the endosomal sorting of ligand-bound EGFR.
Figure 6. TFG depletion by siRNA affects endosomal sorting of EGF:EGFR complexes but not transferrin:receptor complexes.

(A–G) HSC3 cells were transfected with non-targeting (siNT) or TFG (siTFG-1 or siTFG-2) siRNAs and used for experiments after 3 days.
(A) Cells were lysed, and the lysates were probed by western blotting with antibodies to TFG and α-adaptin (αAd, loading control). The amount of residual TFG in depleted cells is presented as percent of TFG amount in control (siNT) cells (n = 9 from several experiments).
(B) Cells were incubated with 20 ng/mL 125I-EGF for 15 min at 37°C, and the amount of surface-bound and internalized 125I-EGF was determined. Mean values with SDs are presented in the bar graph (n = 3). This experiment is representative of three independent experiments. p values were calculated for siTFG-1 and −2 against siNT. ns, p > 0.05.
(C) Schematic design of 125I-EGF recycling/degradation assay. See STAR Methods for details.
(D) 125I-EGF recycling/degradation assay was performed as in (C). Cells were incubated with 20 ng/mL 125I-EGF for 15 min followed by mild acid wash at 4°C and chase incubation at 37°C for 0, 15, and 120 min. The amount of surface-bound, intracellular, intact 125I-EGF in the medium and low molecular weight degradation products of 125I-EGF in the medium were determined and expressed as fractions of total 125I-EGF in 125I-EGF-loaded cells. Bar graphs represent mean values with SDs (n = 3). p values for siTFG-1 and −2 against siNT were calculated using one-way ANOVA (Tukey’s multiple comparison test). p values are not shown if they are >0.05. This experiment is representative of three independent experiments. Efficient TFG depletion was determined in parallel cultures and shown in (E).
(E) TFG deletion in cell cultures grown in parallel with the experiments presented in (D) and (F). Cells were lysed, and the lysates were probed by western blotting with antibodies to TFG and αAd (loading control).
(F) Cells were incubated with Tfn-TxR for 1 hr at 37°C followed by mild acid wash (pH 4.5) to minimize the amount of Tfn-TxR at the cell surface and chased in the presence of excess unlabeled Tfn for 0 or 60 min. The cells were then fixed and stained with DAPI, and 3D images were acquired through 405- (blue, nuclei) and 561-nm (magenta, Tfn-TxR) laser channels. All images are single sections through the middle of the cell of representative 3D images. Scale bars, 10 μm.
(G) Quantification of the amount of Tfn-TxR per cell from images exemplified in (F). Bar graph represents mean values with SEMs (n of 7 FOVs). ns, p > 0.05. p values are calculated for siTFG-1 and −2 against siNT using one-way ANOVA (Tukey’s multiple comparison test). This experiment is representative of two independent experiments.
To test whether TFG depletion affects sorting of a receptor that is predominantly sorted to the recycling rather than degradative pathway from early endosomes regardless of the ligand, we analyzed the effect of TFG siRNAs (Figure 6E) on endocytosis and recycling of the transferrin (Tfn) receptor using Tfn conjugated with TexasRed (Tfn-TxR). After internalization, Tfn-TxR:receptor complexes accumulated in numerous early and recycling endosomes of vesicular and tubular shapes, often concentrated in the perinuclear area of HSC3 cells (Figure 6F). Subsequent chase incubation with an excess of unlabeled Tfn demonstrated a dramatic reduction of the number of Tfn-TxR-containing endosomes and a decrease in total Tfn-TxR fluorescence due to recycling of Tfn-TxR back to the plasma membrane and its replacement by unlabeled Tfn (Figures 6F and 6G). Quantifications showed that TFG depletion did not affect the amount of Tfn-TxR before and after the chase incubation, indicating that TFG does not significantly contribute in the regulation of internalization and recycling of Tfn:receptor complexes.
To test whether TFG is involved in endosomal sorting of ligand-free EGFR, we used a model of HeLa/FAP-EGFR cells in which EGFR internalization is induced by tumor necrosis factor alpha (TNF-α) (Perez Verdaguer et al., 2021). TNF-α transiently activates internalization of ligand-free EGFR mediated by stress-activated p38/MAPK, which is followed by recycling but not degradation (Tanaka et al., 2018). The cells were left untreated or treated with 10 ng/mL TNF-α for 15, 30, or 60 min before labeling FAP-EGFR located at the cell surface with the membrane impermeable fluorogen MG-B-Tau at 4°C. TFG depletion did not alter internalization (15 min) and recycling of FAP-EGFR (Figures S6A and S6B), indicating that the effect of TFG knockdown on EGFR sorting in endosomes was specific to ligand-occupied EGFR. Therefore, based on the data in Figures 6 and S6, we suggest that TFG depletion does not have a pleiotropic effect on endocytic trafficking but that the degradation-inhibiting effect is specific for an endocytic cargo such as ligand-activated endosomal EGFR.
To further explore TFG’s role in endosomal sorting, we tested whether TFG knockdown affects endosomal localization of EEA1 and HGS. Surprisingly, early/sorting endosomes appeared brighter and apparently larger in TFG-depleted cells than in control cells (Figures 7A–7D). Differences in the endosome size were especially revealing in images depicting cells depleted and not fully depleted of TFG next to each other (Figures 7B and 7D). Quantifications showed that TFG knockdown increased the apparent volume of EEA1 and HGS containing early/sorting endosomes (Figures 7A–7H). To further substantiate these observations, we performed analysis of endosomal compartments using correlated light and electron microscopy (CLEM). Control and TFG-depleted HSC3 cells were incubated with 200 nM ferritin for 30 min to label endosomes. High-contrast monochrome light microscopy (LM) images were acquired from ultrathin sections, and electron microscopy (EM) images were acquired from multiple cell regions chosen on LM images to verify that ferritin-positive compartments display the morphology of early endosomes and multivesicular (sorting) endosomes (Figures S7A–S7C). Quantification of LM images revealed that TFG-depleted cells tend to have increased number of endosomes and larger endosomes when compared with cells transfected with non-targeting siRNA (Figures S7D and S7E), although differences could be underestimated because ferritin labels all types of endocytic compartments. Together, fluorescence microscopy and CLEM suggest a role of TFG as a modulator of a general organization of the endolysosomal system. Considering that TFG appears to have a “pro-degradation” function in endosomal sorting of cargo like EGFR (Figure 6), it is possible that impaired maturation of endosomes in the absence of TFG results in a “build-up” of early/sorting endosome proteins, thus leading to enlargement and accumulation of sorting endosomes in the cell.
Figure 7. TFG siRNA depletion causes apparent enlargement of early/sorting endosomes.

(A–D) HSC3 cells transfected with non-targeting (siNT) or TFG siRNAs (siTFG-1) were fixed and co-immunolabeled with TFG and EEA1 (A and B) or HGS antibodies (C and D). 3D confocal images were acquired through 640- (cyan, EEA1 and HGS) and 488-nm (green, TFG) channels. Images in (B) and (D) depict FOVs in which cells with efficient TFG depletion and cells in which substantial amount of TFG is present are shown. Representative maximum intensity projections of 3D images are shown. Asterisks show positions of nuclei. Scale bars, 10 μm.
(E) The apparent volume of EEA1-labeled endosomes was calculated and compared for cells transfected with siNT and siTFG from images exemplified in (A).
(F) The apparent volume of EEA1-labeled endosomes in individual cells was calculated and compared for individual cells transfected with siTFG that display strong depletion of TFG (knockdown [KD]) versus cells with significant residual TFG (no KD) from images exemplified in (B).
(G) The apparent volume of HGS-labeled endosomes was calculated and compared for cells transfected with siNT and siTFG from images exemplified in (C).
(H) The apparent volume of EEA1-labeled endosomes in individual cells was calculated and compared for individual cells transfected with siTFG that display strong depletion of TFG (KD) versus cells with significant residual TFG (no KD) from images exemplified in (D). Bar graphs show mean values with SDs (E: n of 27–28 cells from 4 independent experiments. Mann-Whitney test; F: n of 5 FOVs from 2 independent experiments; paired t test; G: n of 33 FOVs from 4 independent experiments; Mann-Whitney test; H: n of 12 from 3 independent experiments. Wilcoxon matched-pairs test).
After we began initial studies of TFG function in EGFR-containing endosomes, it was reported that TFG is involved in Wnt signaling and co-localizes with HGS (Colozza et al., 2020). Most recently, a role of TFG in ER-associated autophagy was proposed, further supporting potential involvement of TFG in the crosstalk of the endolysosomal system and ER (Carinci et al., 2021). However, another study suggested that ERES-ER-GIC-associated autophagy does not require TFG (Li et al., 2021). We speculate that the TFG function in the endosomal system, possibly promoting sorting to lysosomal degradation pathway, may be similar to the proposed role of TFG in COPII vesicle uncoating and spatially organizing the ERES-ER-GIC trafficking “hub.” In sorting endosomes, TFG may organize multiprotein complexes mediating early-to-late endosome transition and/or intralumenal vesicle formation. TFG was demonstrated to interact with apoptosis-linked gene 2 (ALG-2) that, in turn, interacts with TSG101, a component of the endosomal-sorting complex required for transport (ESCRT-I) and an ESCRT-associated protein ALG-2-interacting protein (ALIX) (Kanadome et al., 2017). However, this latter study proposed that these interactions occur at the ERES rather than on sorting endosomes. Undoubtedly, more studies beyond our initial analysis are needed to precisely define the specific function of TFG in endosomes. However, identification of TFG as a putative regulator of endosomal sorting illustrates the power of APEX2-based time-resolved analysis of the proximity proteomes of endocytosed receptors for discovering new mechanisms of their signaling and endocytic trafficking.
Limitations of the study
The use of cells expressing recombinant EGFR-APEX2 in the presence of endogenous EGFR in the proximity labeling experiments is the limitation of this study because saturable kinetics of EGFR endocytic trafficking processes results in slowing down the ligand-induced down-regulation of EGFR in cells overexpressing this receptor. This limitation is, however, in large part circumvented by the comparative analysis of cells with low and high levels of EGFR, which demonstrated the substantial similarity of proximity proteomes in these cells stimulated with EGF. Our study is also limited by the functional characterization of only a single putative regulator of EGFR in sorting endosomes, TFG. Similar functional analysis of multiple proteins identified in the EGFR proximity proteome at different times during receptor activation, internalization, and trafficking through endolysosomal compartments will be necessary to define the spatiotemporal dynamics of EGFR-associated protein networks.
STAR★METHODS
RESOURCE AVAILABILITY
Lead contact
Further information and requests for resources and reagents should be directed to and will be fulfilled by the lead contact, Alexander Sorkin (sorkin@pitt.edu).
Material availability
Cell lines generated in this study will be available upon request.
Data and code availability
All data generated and analyzed in this study are available from the corresponding author on reasonable request. This paper does not report original code. Any additional information required to reanalyze the data reported in this paper is available from the lead contact upon request.
Source data for mass spectrometry analyses has been deposited to the ProteomeXchange Consortium via the PRIDE partner repository with the dataset identifier Database: PXD030072. The interactive viewer is available at https://wren.hms.harvard.edu/egfr/.
EXPERIMENTAL MODEL AND SUBJECT DETAILS
Cell lines
HEK293T, HCT116 cells (ATCC) and HeLa/FAP-EGFR (Larsen et al., 2019) were maintained with DMEM (Gibco) supplemented with 10% FBS (v/v) and 50 U/ml penicillin and 50 U/ml streptomycin (Gibco). HSC3 cells were maintained in DMEM with 5% FBS. For all experiments cells were serum-starved 16–24 hrs before experimental treatments: for HEK293T and HSCT116 cells culture medium was replaced by DMEM supplemented with 1% FBS and Penicillin-Streptomycin; for HeLa/FAP-EGFR and HSC3 cell culture medium was replaced by DMEM. All experimental treatments were carried out in DMEM supplemented with 0.1% BSA at 37°C (“binding medium”) unless stated otherwise.
Reagents
Recombinant human EGF was purchased from BD Biosciences (San Jose, CA). EGF-Rh and Tfn-TxR were from Molecular Proves (Invitrogen, Carlsbad, CA). TNFα was from Miltenyi Biotec (Germany). Anisomycin (stored as 1 mM stock solution in DMSO at 4°C), was from Sigma-Aldrich (Saint Louis, MO). Rabbit polyclonal EGFR antibodies (AB_2246311) were from Cell Signaling Technology (Danvers, MA). Mouse monoclonal antibody 528 to EGFR (AB_10978829) was from American Type Culture Collection. Mouse monoclonal antibody to phospho-EGFR (pY1068) (AB_331792), phospho-Akt (Ser473) (AB_331158) and phosphorylated ERK1/2 (AB_331768), as well as rabbit polyclonal antibody to Akt (AB_329827) and ERK1/2 (AB_330744) were from Cell Signaling Technology. Mouse monoclonal antibody to HGS (AB_1124436) was from Santa Cruz Biotechnology (Dallas, TX). Monoclonal IgG2a antibody to α-adaptin (α subunit of AP2) (AB_2056321) was from ThermoFisher (Waltham, MA). Mouse monoclonal antibodies to EEA1 (AB_397829), Sec31 (AB_399717) and Rab5 (AB_398047) were from BD Transduction (Franklin Lakes, NJ). Rabbit polyclonal antibody to TFG (AB_2664282) was from Invitrogen. Secondary anti-mouse and anti-rabbit IRDye antibodies were from Li-COR (Lincoln, NE). Secondary anti-mouse and anti-rabbit conjugated to Alexa488 or Alexa640 were from Jackson Immune (West Grove, PA). Donkey anti-mouse antibody conjugated with Cy5 were also from Jackson Immune. MG-B-Tau was provided by Dr. M. Bruchez (Carnegie Mellon University). Ferritin (F4503) was from Sigma-Aldrich.
Expression plasmids
We created plasmids to express APEX2 tagged EGFR in HCT116 and HEK293T cells. Gateway entry clones pDONR223-EGFR-WT (#81926) were purchased from Addgene. pLEX-305 (#41390) lentiviral backbone vector was engineered to substitute the hPKG (phosphoglycerate kinase) promoter with the CMV (human cytomegalovirus) promoter plus APEX2 tag in the C-terminus of the expression gene. pDONR223_EGFR_WT (#81926) were transferred to pLEX305_Cterm_APEX2 destination vector using Gateway LR Clonase II enzyme mix (Thermo Fisher) based on the provided protocol. Gateway cloning product was transformed into One Shot™ BL21(DE3) chemically competent E.coli (Thermo Fisher). GFP-TFG was provided by Dr. Hideki Shibata (Nagoya University, Chikusa-ku, Nagoya, Japan).
DNA plasmid transfections, generation of stable cell lines and RNA interference
HSC3 cells were transfected with the GFP-TFG plasmid using Lipofectamine 2000 (ThermoFisher Scientific) following manufacturer’s instructions and used for experiments 48 hrs later. For generation of EGFR-APEX2 stable cell lines, one day before transfection, we seeded HEK293T cells at 70% to 90% confluence. 5 μg validated clones were combined with viral helper constructs (VSVG, TAT1B, MGPM2, CMV-Rev1B) at a ratio 4:1 and diluted in 500 μL Opti-MEM with 30 μL P3000 Reagent. Diluted DNA was added to 500 μL Opti-MEM with 22 μL Lipofectamine 3000 reagent. The mixture was incubated at room temperature for 15 min and then added to cells. The cells were grown for three days for virus production. Virus was collected and filtered using Millex-GP Syringe Filter Unit, 0.45 um (EMD Millipore). Various amounts of collected virus were added to HEK293T or HCT116 cells. After 48 hrs, 2 μg/mL and 0.5 μg/mL puromycin were added for selection of single clones of HEK293T and HCT116 cells expressing EGFR-APEX2, respectively.
Non-targeting siRNA was purchased from Qiagen (Venlo, Netherlands). TFG targeting siRNA duplexes (individual siGENOME grade): sense sequence: 5′-CCAAAAGACUCCAGUACUAUU; antisense sequence: 5′-UAGUACUGGAGUCUUUUGGUU, and siGENOME SMARTPool (Catalog ID: M-016366-01-0005) siRNAs were purchased from Dharmacon (Lafayette, CO). Cells were reverse transfected with 50 nM siRNA and 3.5 μL DharmaFECT-1 in 1 mL of complete media (without antibiotics) and grown in 6-well dishes without antibiotics. 2 days later, cells were split and plated in coverslips or other dishes. 6 hrs after, media was changed to serum-free DMEM, and the cells were used for experiments the next day (day 3 after siRNA transfection).
Western blotting
Cells were lysed and processed for Western blotting as described in (Larsen et al., 2019). Quantifications of band intensities were performed using ImageJ or Li-COR software.
125I-EGF internalization, recycling and degradationassays
Mouse receptor grade EGF (Corning) was 125I-conjugated, and 125I-EGF internalization, recycling and degradation assays were performed as described (Sorkin and Duex, 2010). Briefly, for internalization assays, confluent cells in 12-well plates were incubated with 125I-EGF for indicated times at 37°C in the absence or presence of excess unlabeled EGF (to estimate the background binding). Endocytosis was stopped by washing with ice-cold DMEM, and surface-bound 125I-EGF was stripped by 5-min incubation with ice-cold 0.2 M sodium acetate buffer, 0.5M NaCl (pH 2.8) and collected. Cells were then lysed in 1 N NaOH to determine the amount of internalized 125I-EGF. After background subtraction, the amounts of surface and internalized 125I-EGF per well were calculated, and the ratio of internalized to total cell-associated 125I-EGF were plotted against time.
For endosomal sorting (“recycling versus degradation”) assays, the cells in 12-well plates were incubated with 20 ng/mL 125I-EGF for 15 min at 37°C and washed with cold DMEM. 125I-EGF that had not been internalized during 37°C incubation was removed from the cell surface by a 2.5-min mild acidic wash (0.2 M sodium acetate, 0.5 M NaCl, pH 4.5) at 4°C. At this point, the cells are referred to as “125I-EGF-loaded cells”. Trafficking of internalized 125I-EGF-receptor complexes was then re-initiated by incubating the cells in fresh binding medium at 37°C for 0–120 min. At the end of the chase incubation, the medium was collected to measure the amount of intact and degraded 125I-EGF by precipitation of intact ligand with the mixture of trichloroacetic (TCA) and phosphotungstic acids (Sorkin and Duex, 2010). The cells were then subjected to an acid wash (pH 2.8) as described above in internalization experiments to determine the amount of surface-bound 125I-EGF. This amount was negligible at the chase time point ‘0’ (1–2% of total cell associated radioactivity), suggesting that the first acidic treatment (pH 4.5) efficiently removed surface 125I-EGF. Finally, cells were solubilized in 1N NaOH to measure the amount of intracellular 125I-EGF. The amount of recycled 125I-EGF is a sum surface-bound 125I-EGF and intact 125I-EGF in the medium after chase incubation. The amounts of surface-bound, medium intact and degraded 125I-EGF were expressed as fractions of the total radioactivity associated with cells (internalized + surface-bound + total medium 125I-EGF) which was calculated at each time point.
Proximity-based labeling
After a 24 hrs starvation, biotinyl tyramide (BT; Toronto Research Chemicals) stock was added directly into starvation media to a final concentration of 500 μM. All cells were incubated in labeling medium for 1 h before collection for solubilization. EGF was added to treat the cells for various times before collection for solubilization. An equal volume of PBS buffer (vehicle) was added to control cells. Hydrogen peroxide was freshly diluted from a 2M H2O2 stock and added into the medium to a final concentration of 1 mM 59 min after the start of incubation with BT to initialize the labeling reaction. After 1 min of H2O2 treatment, cells were washed with ice-cold quenching solution (PBS supplemented with 10 mM sodium ascorbate, 5 mM trolox, and 10 mM sodium azide) thrice and quenching solution with 5 mM EDTA once. 1 mL ice-cold lysis buffer (2 M sodium hydroxide with 7.5% 2-mercaptoethanol in Milli-Q water) was added directly to the plate to harvest the cells. Cell lysates were stored at −80°C until the next step.
Streptavidin pull-down of biotinylated proteins
Cell lysates were syringe lysed to fragment DNA (20x with 21gauge needle), 0.7 mL ice-cold TCA was added, and the samples were incubated on ice for 15 min. Proteins were precipitated by centrifugation at 21,130 × g at 4°C for 10 min. Pellets were washed with −20°C cold acetone, vortexed, and centrifuged at 21,130 × g at 4°C for 10 min. This step was repeated with ice-cold methanol. Methanol was aspirated and 0.8 mL resuspension buffer (8M urea, 100 mM sodium phosphate pH 8, 100 mM NH4HCO3, 1% SDS (v/v)), were added to the pellets. The pellets were vortexed and suspended in the lysis buffer. A BCA assay determined the protein concentration and an equal amount (2.5–3 mg) of protein was used for each sample for the following steps. Samples were reduced with 5 mM TCEP, alkylated with 10 mM iodoacetamide, and quenched with 15 mM DTT. 50 mM ammonium bicarbonate was added to each sample to reach final concentrations of 4 M urea and 0.5% (vol/vol) of SDS. A 75 μL suspension equivalent per sample of streptavidin magnetic beads (Thermo Fisher Scientific, stock is at 10mg/mL, 100 μL can bind 55 μg) were washed twice with 4M urea, 0.5% SDS (vol/vol), 100 mM sodium phosphate pH 8, 75 μL of beads were added to each sample, and tubes were rotated for 3 hrs at RT. Following the streptavidin pull-down, magnetic beads were washed thrice with 4 M urea, 0.5% SDS (vol/vol), 100 mM sodium phosphate pH 8, once with the 4 M urea, 100 mM sodium phosphate pH 8, and once with 200 mM EPPS pH 8.5 sequentially to remove the SDS in the samples.
On-beads digestion and TMT labeling
Washed beads were re-suspended in 100 μL EPPS pH 8.5. 1μL of LysC stock solution (2 mg/mL, Wako) was added into each sample. Samples were vortexed briefly and incubated at 37°C for 3 h with shaking. Trypsin stock (Promega #V51113) 1:200 (vol/vol) was then added for further digestion overnight at 37°C with shaking. Magnetic beads were removed from the samples. 30 μL acetonitrile were added into each sample. 100 μg of each TMT 10plex (or TMT 9/11plex) reagent were used for labeling. After 1 h labeling, 2 μL of each sample were combined, desalted, and analyzed using mass spectrometry. Total intensities were calculated in each channel to determine normalization factors. After quenching using 0.3% hydroxylamine, samples were combined at a 1:1 ratio of peptides based on normalization factors, dried, and fractionated using High pH Reversed-Phase Peptide Fractionation kit (Pierce). Six fractions were dried, desalted, and analyzed by liquid chromatography-tandem mass spectrometry (LC-MS/MS).
LC-MS/MS
The data acquisition method was as described previously (Navarrete-Perea et al., 2018). Briefly, mass spectrometric data were collected on an Orbitrap Fusion Lumos mass spectrometer coupled to a Proxeon NanoLC-1200 UHPLC. The 100 μm capillary column was packed in-house with 35 cm of Accucore 50 resin (2.6 μm, 150Å; ThermoFisher Scientific). The mobile phase was 5% acetonitrile, 0.125% formic acid and 95% acetonitrile, 0.125% formic acid. The data were collected using a DDA-SPS-MS3 method. Each fraction was eluted across a 120 min method with a gradient from 6% to 30% B. Peptides were ionized with a spray voltage of 2,600 kV. The instrument method included Orbitrap MS1 scans (resolution of 120K; mass range 350–1,400 m/z; automatic gain control (AGC) target 5 × 10⁵, max injection time of 50 ms) and ion trap MS2 scans (isolation window: 0.5, CID collision energy of 35%; AGC target 1 × 10⁴; rapid scan mode; max injection time of 60 ms). MS3 precursors were fragmented by HCD and analyzed using the Orbitrap (NCE 65%, AGC 3 × 10⁵, maximum injection time 150 ms, resolution was 50,000 at 400 Th). The mass spectrometry proteomics data have been deposited to the ProteomeXchange Consortium via the PRIDE (Perez-Riverol et al., 2019) partner repository with the dataset identifier Database: PXD030072.
Data analysis
Mass spectra were processed using a SEQUEST-based software pipeline and searched against the human UniProt database (Downloaded in 2014–02-14). Searches were performed using a 50-ppm precursor ion tolerance and 0.9 Da ion tolerance. TMT tags on lysine residues and peptide N termini (+229.163 Da) and carbamidomethylation of cysteine residues (+57.021 Da) were set as static modifications. Oxidation of methionine residues (+15.995 Da) was set as a variable modification. Peptide-spectrum matches (PSMs) were identified, quantified and filtered to a 1% peptide false discovery rate (FDR). In APEX protein quantitation, peptides were collapsed to a final protein-level FDR of 1%. Proteins were quantified by summing reporter ion counts across all matching PSMs. Briefly, a 0.003 Da (3 millidalton) window around the theoretical m/z of each reporter ion was scanned and the maximum intensity nearest the theoretical m/z was used. For each protein, signal-to-noise (S:N) measurements of the peptides were summed, and these values were normalized to the EGFR level in each channel. Proteins with summed signal-to-noise greater than 100 were used for further analysis.
Live-cell microscopy
Cells transiently expressing GFP-TFG were grown in 35-mm Mattek dishes. Serum-starved cells were incubated with EGF-Rh (10 ng/mL) for 15 min at 37°C, and 3D images were acquired through 488 nm (GFP) and 561 nm (Rhodamine) filter channels at room temperature (RT) to minimize endosome movement during image acquisition.
Transferrin internalization and recycling
Cells grown in 35-mm Mattek dishes were incubated with Tfn-TxR for 1 h at 37°C and washed with ice-cold DMEM, followed by mild acid wash (0.2 mM Na-acetate, pH 4.5, 0.5 M NaCl) for 2 min at 4°C and cold DMEM rinse to neutralize acidic buffer. This minimizes the amount of Tfn-TxR remaining bound to surface receptors. The cells were then chased in the binding medium containing 100 μg/mL unlabeled Tfn for 0 or 60 min. The cells were then fixed in freshly prepared 4% para-formaldehyde (PFA), stained with DAPI, and z-stack of 20 x-y confocal images were acquired at 400 nm steps through 405 nm (DAPI) and 561 nm (Tfn-TxR) laser channels.
Immunofluorescence microscopy
Cells were grown on glass coverslips, and after indicated treatments, fixed in freshly prepared 4% PFA for 15 min, washed with Ca2+, Mg2+-free PBS (CMF-PBS), permeabilized in 0.1% Triton X-100/CMF-PBS for 15 min and blocked for 30 min in 0.1% BSA in CMF-PBS. Cells were then incubated for 1h with primary and secondary antibodies in blocking buffer. Samples were mounted in Mowiol (Calbiochem). All procedures with fixed cells were carried out at RT.
Detection and measurement of cell-surface FAP-EGFR
HeLa/FAP-EGFR cells were grown on glass coverslips. Cells were treated with 10 ng/mL TNFα at 37°C for indicated times, washed with cold CMF-PBS and incubated with 100 nM MG-B-Tau in CMF-PBS for 10 min on ice. Finally, cells were washed in CMF-PBS and fixed with 4% freshy prepared PFA for 15 min at RT, washed in CMF-PBS and imaged immediately.
Spinning disk confocal microscopy
Images were acquired with a spinning-disk Marianas system based on a Zeiss Axio Observer Z1 inverted fluorescence microscope equipped with 63x Plan Apo PH NA 1.4 oil immersion objective, piezo stage controller, spherical aberration correction module, temperature- and CO2-controlled chamber, all controlled by Slidebook6 software (Intelligent Imaging Innovation, Denver, CO) as described previously (Larsen et al., 2019; Perez Perez Verdaguer et al., 2019). For immunofluorescence imaging, Hamamatsu Flash4 camera was used to obtain z stack of 15 x-y confocal images acquired at 250–400 nm z-steps. For surface FAP-EGFR and Tfn recycling measurements, an Evolve EM-CCD camera was used. For live-cell imaging, Fusion BT CMOS camera (Hamamatsu) was used. Image acquisition settings were identical for all variants in each experiment. Typically, 6–10 FOVs, each including several cells, were imaged per condition in each experiment.
Image analysis
To quantify the amount of TFG localized at ERES or in endosomes, a colocalization analysis was performed using Slidebook6. A segment mask was generated to select ERES (Sec31), early/sorting endosomes (EEA1, HRS, Rab5) or EGF-Rh vesicles detected through the 640 nm (Alexa647) or 561 nm (Rhodamine) channels (Target Compartment mask) in background subtracted images. Another segment mask was generated to select TFG-positive voxels in the 488 nm channel (TFG mask). For both masks identical threshold parameters were used for all experimental variants. Objects smaller than 6 voxels were eliminated. A Colocalization mask was then generated to select voxels overlapping in the Target Compartment and TFG masks. In immunofluorescence experiments, the sum fluorescence intensity through the 488 nm channel in the Colocalization mask was divided by the sum fluorescence intensity of the TFG mask in each FOV or individual cell. To quantify the apparent volume of endosomes, the total volume of Target Compartment mask was divided by the number of objects in the mask. Quantification of TFG fraction co-localized with EGFR labeled with antibody 528 were performed as described above with the exception that images were deconvoluted using an iterative constrain algorithm of SlideBook6 to minimize out-of-focus fluorescence due to a large amount of diffusely distributed plasma membrane EGFR.
To quantify the amount of EGF-Rh co-localized with GFP-TFG In living cells, a segment mask was generated to select EGF-Rh vesicles (EGF mask) in background subtracted images. Another segment mask was generated to select GFP-TFG-positive voxels in the 488 nm channel (TFG mask). A Colocalization mask was then generated to select voxels overlapping in the EGF and GFP-TFG masks. The sum fluorescence intensity of EGF-Rh in the Colocalization mask was divided by the sum fluorescence intensity of EGF-Rh in the EGF mask. Calculations were made for individual cells.
To measure the amount of cells-surface FAP-EGFR, the sum intensity of the 640 nm channel (MG-B-Tau) per FOV was obtained. The mean value of MG-B-Tau fluorescence intensity at 15 min was subtracted from each value at 30 min and 60 min of TNFα stimulation and the resulting value was then normalized by the mean value of this intensity obtained in untreated cells to obtain the recovery fraction.
To quantify the amount of endosomal Tfn-TxR per cell, a segment mask was generated to select vesicular and tubular compartments detected through the 561 nm channel. Integrated fluorescence intensity (in arbitrary linear units of fluorescence intensity) was obtained for each background-subtracted FOV and divided by the number of cells in the FOV. Number of cells was quantitated from the same mask using DAPI images and manually confirmed for each image. Cells that were only partially depicted in the image were either eliminated from calculations or included as halfs of the cell.
CLEM
Cell incubated with ferritin were fixed for 30 min in 2.5% glutaraldehyde (Taab) in PBS, and washed 3x in PBS before postfixing in 1% osmium tetroxide for 1 hr. Following dehydration through a graded series of alcohols, epoxy resin Beem capsules full of resin were inverted over random areas of the culture dish and the resin cured for 24 hrs. The resin filled Beem capsules were snapped of the dish, trimmed to a trapezoid and sections cut with a Leica UltraCut R (Leica Microsystems Mannheim Germany) microtome. Ultrathin (60 nm) sections were mounted on Formvar coated 3 slot copper grids and stained with uranyl acetate and lead citrate (Watkins and Cullen, 1986), serial 200 nm thick sections were mounted on glass slides and stained with 1% Toluidine blue for 5 min.
The high contrast intracellular nature of ferritin positive structures within semi-thin sections of EM blocks viewed by light microscopy allows the use of neural network training of segmentation of the ferritin positive structures within sections. Monochromatic brightfield image montages (3 × 3 images) were collected using a carefully aligned Nikon Ti microscope (Nikon instruments, Tokyo Japan) with a 100× 1.49 NA TIRF objective and a 1.5× intermediate magnifying lens collected to a Teledyne Photometrics 95B camera (Photometrics, Tucson Arizona) with 1800 × 1800 pixels and a 25 × 25 mm chip sensor (11 μm pixels). Final calibrated pixel size is 0.07 μm on each axis. To generate correlative images between light and EM modalities, low magnification images (20× 0.75NA) of the entire section were collected and used to find reference areas in the serial EM sections, such that the identity of ferritin positive structures could be confirmed. EM images were collected using a JEOL 1200 Flash (Peabody Ma) electron microscope.
To quantify the number and size of ferritin positive structures (endosomes) in each cell and treatment condition, we used NIS Elements and the AI segmentation tool. A ground truth dataset was generated by manually highlighting and defining structures in the monochrome LM images. A second training set was used to segment out the cell boundaries such that following training we are able to collect the number of ferritin positive structures and size (area) of individual ferritin-positive structures in each cell. Five 3 × 3 montages were collected for each condition and the entire montages were passed through the trained segmentation algorithm. In total 600–800 cells per condition were analyzed. Only cells within the field of view and with nuclei were included in the analysis. To show the distribution of the number of endosomes per cell within cell population, cells were classified in arbitrary categories according to their endosome number. To show the distribution of endosome size within cell population, averaged area of individual endosomes in each cell was quantified, and the cells were classified in arbitrary categories of this averaged area of endosomes.
QUANTIFICATION AND STATISTICAL ANALYSIS
Statistical analyses of fluorescence microscopy, CLEM and blotting experiments were performed using GraphPad Prism software (GraphPad). We tested our datasets for normal distribution with Shapiro-Wilk test and chose an appropriate test accordingly. We used unpaired Student’s t-test or Mann-Whitney test for comparisons of two samples with equal or unequal variance respectively. In Figures 7F and 7H paired Student’s t-test or Wilcoxon test were used. For comparison of multiple groups, a one-way ANOVA or Kruskal-Wallis test respectively followed by Tukey’s or Dunn’s post hoc tests were used. All error bars denote mean ± SD unless otherwise indicated in figure legend. *p < 0.05, **p < 0.01, ***p < 0.001. The number of individual experiments analyzed are indicated in the figure legends.
Supplementary Material
KEY RESOURCES TABLE.
| REAGENT or RESOURCE | SOURCE | IDENTIFIER |
|---|---|---|
|
| ||
| Antibodies | ||
|
| ||
| Mouse monoclonal to pTyr1068 EGFR | Cell Signaling Technology | RRID: AB_331792 |
| Rabbit polyclonal to EGFR | Cell Signaling Technology | RRID: AB_2246311 |
| Mouse monoclonal antibody 528 to EGFR | ATCC | RRID: AB_10978829 |
| Rabbit polyclonal to phospho-ERK1/2 | Cell Signaling Technology | RRID: AB_331768 |
| Mouse monoclonal to phospho-Akt (Ser473) | Cell Signaling Technology | RRID: AB_331158 |
| Rabbit polyclonal to Akt | Cell Signaling Technology | RRID: AB_329827 |
| Mouse monoclonal to HGS | Santa Cruz Biotechnology | RRID: AB_1124436 |
| Mouse monoclonal to α-adaptin | ThermoFisher | RRID: AB_2056321 |
| Mouse monoclonal to EEA1 | BD Transduction | RRID: AB_397829 |
| Mouse monoclonal to Sec31 | BD Transduction | RRID: AB_399717 |
| Mouse monoclonal to Rab5 | BD Transduction | RRID: AB_398047 |
| Rabbit polyclonal to TFG | Invitrogen | RRID: AB_2664282 |
|
| ||
| Chemicals, peptides, and recombinant proteins | ||
|
| ||
| human recombinant EGF | BD Bioscience | Cat # 354052 |
| mouse receptor-grade EGF | Corning | Cat # 354010 |
|
| ||
| Deposited data | ||
|
| ||
| Source data for mass spectrometry analyses | This paper | PXD030072 |
|
| ||
| Experimental models: Cell lines | ||
|
| ||
| Human: HCT116 | ATCC | RRID: CVCL_0291 |
| Human: HEK293T | ATCC | RRID: CVCL_0063 |
| Human: HSC3 cells | Pinilla-Macua et al., 2017 | RRID: CVCL_1288 |
| Human: HeLa/FAP-EGFR cells | Larsen et al., 2019 | N/A |
|
| ||
| Oligonucleotides | ||
|
| ||
| siRNA targeting sequence: TFG: 5’-CCAAAAGACUCCAGUACUAUU | Dharmacon | N/A |
| siRNA targeting sequence: TFG: siGENOME SMARTPool | Dharmacon | Catalog ID: M-016366-01-0005) |
|
| ||
| Recombinant DNA | ||
|
| ||
| pDONR223-EGFR-WT | Addgene | #81926 |
| pLEX-305 | Addgene | #41390 |
| GFP-TFG | Kanadome et al., 2017 | N/A |
|
| ||
| Software and algorithms | ||
|
| ||
| SlideBook6 | Intelligent-imaging Innovations, Inc. | https://www.intelligent-imaging.com/ |
| Image Studio™ Lite | Li-COR, Inc. | https://www.licor.com/ |
| NIS Elements | Nikon | https://www.microscope.healthcare.nikon.com/ |
Highlights.
Proximity proteome of activated EGFR tracked by time-resolved APEX-mediated labeling
Multiple signaling proteins remain proximal to EGFR during its endocytosis
Trk-fused gene (TFG) is associated with early and sorting endosomes
TFG regulates endosomal sorting of EGFR
ACKNOWLEDGMENTS
We appreciate gifts of reagents by Drs. Bruchez and Shibata. We are grateful to Ms. M. Sullivan for technical help with EM. This work was supported by NIH grants GM124186 (A.S. and S.C.W.) and CA089151 (A.S. and S.P.G.). M.P.V. and S.S. were supported by the National Cancer Center fellowship.
Footnotes
DECLARATION OF INTERESTS
The authors declare no competing interests.
SUPPLEMENTAL INFORMATION
Supplemental information can be found online at https://doi.org/10.1016/j.celrep.2022.110950.
REFERENCES
- Baulida J, Kraus MH, Alimandi M, Fiore PPD, and Carpenter G (1996). All ErbB receptors other than the epidermal growth factor receptor are endocytosis impaired. J. Biol. Chem. 271, 5251–5257. 10.1074/jbc.271.9.5251. [DOI] [PubMed] [Google Scholar]
- Carinci M, Testa B, Bordi M, Milletti G, Bonora M, Antonucci L, Ferraina C, Carro M, Kumar M, Ceglie D, et al. (2021). TFG binds LC3C to regulate ULK1 localization and autophagosome formation. EMBO J. 40, e103563. 10.15252/embj.2019103563. [DOI] [PMC free article] [PubMed] [Google Scholar]
- Chinkers M, McKanna JA, and Cohen S (1979). Rapid induction of morphological changes in human carcinoma cells A-431 by epidermal growth factors. J. Cell Biol. 83, 260–265. 10.1083/jcb.83.1.260. [DOI] [PMC free article] [PubMed] [Google Scholar]
- Colozza G, Jami-Alahmadi Y, Dsouza A, Tejeda-Munoz N, Albrecht LV, Sosa EA, Wohlschlegel JA, and De Robertis EM (2020). Wnt-inducible Lrp6-APEX2 interacting proteins identify ESCRT machinery and Trk-fused gene as components of the Wnt signaling pathway. Sci. Rep. 10, 21555. 10.1038/s41598-020-78019-5. [DOI] [PMC free article] [PubMed] [Google Scholar]
- Foerster S, Kacprowski T, Dhople VM, Hammer E, Herzog S, Saafan H, Bien-Möller S, Albrecht M, Völker U, and Ritter CA (2013). Characterization of the EGFR interactome reveals associated protein complex networks and intracellular receptor dynamics. Proteomics 13, 3131–3144. 10.1002/pmic.201300154. [DOI] [PubMed] [Google Scholar]
- Francavilla C, Papetti M, Rigbolt KTG, Pedersen AK, Sigurdsson JO, Cazzamali G, Karemore G, Blagoev B, and Olsen JV (2016). Multilayered proteomics reveals molecular switches dictating ligand-dependent EGFR trafficking. Nat. Struct. Mol. Biol. 23, 608–618. 10.1038/nsmb.3218. [DOI] [PMC free article] [PubMed] [Google Scholar]
- Grandis JR, and Sok JC (2004). Signaling through the epidermal growth factor receptor during the development of malignancy. Pharmacol. Ther. 102, 37–46. 10.1016/j.pharmthera.2004.01.002. [DOI] [PubMed] [Google Scholar]
- Haigler HT, McKanna JA, and Cohen S (1979). Direct visualization of the binding and internalization of a ferritin conjugate of epidermal growth factor in human carcinoma cells A-431. J. Cell Biol. 81, 382–395. 10.1083/jcb.81.2.382. [DOI] [PMC free article] [PubMed] [Google Scholar]
- Hanna M.G.t., Block S, Frankel EB, Hou F, Johnson A, Yuan L, Knight G, Moresco JJ, Yates JR 3rd, Ashton R, et al. (2017). TFG facilitates outer coat disassembly on COPII transport carriers to promote tethering and fusion with ER-Golgi intermediate compartments. Proc. Natl. Acad. Sci. U S A 114, e7707–e7716. 10.1073/pnas.1709120114. [DOI] [PMC free article] [PubMed] [Google Scholar]
- Huttlin EL, Bruckner RJ, Navarrete-Perea J, Cannon JR, Baltier K, Gebreab F, Gygi MP, Thornock A, Zarraga G, Tam S, et al. (2021). Dual proteome-scale networks reveal cell-specific remodeling of the human interactome. Cell 184, 3022–3040.e28. 10.1016/j.cell.2021.04.011.e3028. [DOI] [PMC free article] [PubMed] [Google Scholar]
- Itzhak DN, Tyanova S, Cox J, and Borner GH (2016). Global, quantitative and dynamic mapping of protein subcellular localization. Elife 5. 10.7554/elife.16950. [DOI] [PMC free article] [PubMed] [Google Scholar]
- Johnson A, Bhattacharya N, Hanna M, Pennington JG, Schuh AL, Wang L, Otegui MS, Stagg SM, and Audhya A (2015). TFG clusters COPII-coated transport carriers and promotes early secretory pathway organization. EMBO J. 34, 811–827. 10.15252/embj.201489032. [DOI] [PMC free article] [PubMed] [Google Scholar]
- Kanadome T, Shibata H, Kuwata K, Takahara T, and Maki M (2017). The calcium-binding protein ALG-2 promotes endoplasmic reticulum exit site localization and polymerization of Trk-fused gene (TFG) protein. FEBS J. 284, 56–76. 10.1111/febs.13949. [DOI] [PubMed] [Google Scholar]
- Komada M, and Kitamura N (1995). Growth factor-induced tyrosine phosphorylation of Hrs, a novel 115-kilodalton protein with a structurally conserved putative zinc finger domain. Mol. Cell Biol. 15, 6213–6221. 10.1128/mcb.15.11.6213. [DOI] [PMC free article] [PubMed] [Google Scholar]
- Kudo Y, Kitajjma S, Sato S, Miyauchi M, Ogawa I, and Takata T (2003). Establishment of an oral squamous cell carcinoma cell line with high invasive and p27 degradation activities from a lymph node metastasis. Oral Oncol. 39, 515–520. 10.1016/s1368-8375(03)00015-0. [DOI] [PubMed] [Google Scholar]
- Lam SS, Martell JD, Kamer KJ, Deerinck TJ, Ellisman MH, Mootha VK, and Ting AY (2015). Directed evolution of APEX2 for electron microscopy and proximity labeling. Nat. Methods 12, 51–54. 10.1038/nmeth.3179. [DOI] [PMC free article] [PubMed] [Google Scholar]
- Larsen MB, Perez Verdaguer M, Schmidt BF, Bruchez MP, Watkins SC, and Sorkin A (2019). Generation of endogenous pH-sensitive EGF receptor and its application in high-throughput screening for proteins involved in clathrin-mediated endocytosis. Elife 8, e46135. 10.7554/elife.46135. [DOI] [PMC free article] [PubMed] [Google Scholar]
- Lemmon MA, and Schlessinger J (2010). Cell signaling by receptor tyrosine kinases. Cell 141, 1117–1134. 10.1016/j.cell.2010.06.011. [DOI] [PMC free article] [PubMed] [Google Scholar]
- Li S, Yan R, Xu J, Zhao S, Ma X, Sun Q, Zhang M, Li Y, Liu JJG, Chen L, et al. (2021). A new type of ERGIC-ERES membrane contact mediated by TMED9 and SEC12 is required for autophagosome biogenesis. Cell Res. 32, 119–138. 10.1038/s41422-021-00563-0. [DOI] [PMC free article] [PubMed] [Google Scholar]
- Lobingier BT, Huttenhain R, Eichel K, Miller KB, Ting AY, von Zastrow M, and Krogan NJ (2017). An approach to spatiotemporally resolve protein interaction networks in living cells. Cell 169, 350–360.e12. 10.1016/j.cell.2017.03.022. [DOI] [PMC free article] [PubMed] [Google Scholar]
- Mellman I, and Yarden Y (2013). Endocytosis and cancer. Cold Spring Harbor Perspect. Biol. 5, a016949. 10.1101/cshperspect.a016949. [DOI] [PMC free article] [PubMed] [Google Scholar]
- Navarrete-Perea J, Yu Q, Gygi SP, and Paulo JA (2018). Streamlined tandem mass tag (SL-TMT) protocol: an efficient strategy for quantitative (Phospho)proteome profiling using tandem mass tag-synchronous precursor selection-MS3. J. Proteome Res. 17, 2226–2236. 10.1021/acs.jproteome.8b00217. [DOI] [PMC free article] [PubMed] [Google Scholar]
- Paek J, Kalocsay M, Staus DP, Wingler L, Pascolutti R, Paulo JA, Gygi SP, and Kruse AC (2017). Multidimensional tracking of GPCR signaling via peroxidase-catalyzed proximity labeling. Cell 169, 338–349.e11. 10.1016/j.cell.2017.03.028.e311. [DOI] [PMC free article] [PubMed] [Google Scholar]
- Peotter J, Kasberg W, Pustova I, and Audhya A (2019). COPII-mediated trafficking at the ER/ERGIC interface. Traffic 20, 491–503. 10.1111/tra.12654. [DOI] [PMC free article] [PubMed] [Google Scholar]
- Perez-Riverol Y, Csordas A, Bai J, Bernal-Llinares M, Hewapathirana S, Kundu DJ, Inuganti A, Griss J, Mayer G, Eisenacher M, et al. (2019). The PRIDE database and related tools and resources in 2019: improving support for quantification data. Nucleic Acids Res. 47, D442–D450. 10.1093/nar/gky1106. [DOI] [PMC free article] [PubMed] [Google Scholar]
- Perez Verdaguer M, Larsen MB, Bruchez MP, Watkins SC, and Sorkin A (2019). Analysis of EGF receptor endocytosis using fluorogen activating protein tagged receptor. Bio Protoc. 9, e3463. 10.21769/bioprotoc.3463. [DOI] [PMC free article] [PubMed] [Google Scholar]
- Perez Verdaguer M, Zhang T, Paulo JA, Gygi S, Watkins SC, Sakurai H, and Sorkin A (2021). Mechanism of p38 MAPK-induced EGFR endocytosis and its crosstalk with ligand-induced pathways. J. Cell Biol. 220. 10.1083/jcb.202102005. [DOI] [PMC free article] [PubMed] [Google Scholar]
- Pinilla-Macua I, Grassart A, Duvvuri U, Watkins SC, and Sorkin A (2017). EGF receptor signaling, phosphorylation, ubiquitylation and endocytosis in tumors in vivo. Elife 6. 10.7554/elife.31993. [DOI] [PMC free article] [PubMed] [Google Scholar]
- Pinilla-Macua I, Watkins SC, and Sorkin A (2016). Endocytosis separates EGF receptors from endogenous fluorescently labeled HRas and diminishes receptor signaling to MAP kinases in endosomes. Proc. Natl. Acad. Sci. U S A 113, 2122–2127. 10.1073/pnas.1520301113. [DOI] [PMC free article] [PubMed] [Google Scholar]
- Raiborg C, Wesche J, Malerød L, and Stenmark H (2006). Flat clathrin coats on endosomes mediate degradative protein sorting by scaffolding Hrs in dynamic microdomains. J. Cell Sci. 119, 2414–2424. 10.1242/jcs.02978. [DOI] [PubMed] [Google Scholar]
- Rao RK, and Clayton LW (2002). Regulation of protein phosphatase 2A by hydrogen peroxide and glutathionylation. Biochem. Biophys. Res. Commun. 293, 610–616. 10.1016/s0006-291x(02)00268-1. [DOI] [PubMed] [Google Scholar]
- Reynolds AR, Tischer C, Verveer PJ, Rocks O, and Bastiaens PIH (2003). EGFR activation coupled to inhibition of tyrosine phosphatases causes lateral signal propagation. Nat. Cell Biol. 5, 447–453. 10.1038/ncb981. [DOI] [PubMed] [Google Scholar]
- Sibilia M, Kroismayr R, Lichtenberger BM, Natarajan A, Hecking M, and Holcmann M (2007). The epidermal growth factor receptor: from development to tumorigenesis. Differentiation 75, 770–787. 10.1111/j.1432-0436.2007.00238.x. [DOI] [PubMed] [Google Scholar]
- Sigismund S, Lanzetti L, Scita G, and Di Fiore PP (2021). Endocytosis in the context-dependent regulation of individual and collective cell properties. Nat. Rev. Mol. Cell Biol. 22, 625–643. 10.1038/s41580-021-00375-5. [DOI] [PubMed] [Google Scholar]
- Sorkin A, and Duex JE (2010). Quantitative analysis of endocytosis and turnover of epidermal growth factor (EGF) and EGF receptor. Curr. Protoc. Cell Biol. 46, 15.14. 10.1002/0471143030.cb1514s46. [DOI] [PMC free article] [PubMed] [Google Scholar]
- Sorkin A, and Goh LK (2009). Endocytosis and intracellular trafficking of ErbBs. Exp. Cell Res. 315, 683–696. 10.1016/j.yexcr.2008.07.029. [DOI] [PubMed] [Google Scholar]
- Sorkin A, and Von Zastrow M (2002). Signal transduction and endocytosis: close encounters of many kinds. Nat. Rev. Mol. Cell Biol. 3, 600–614. 10.1038/nrm883. [DOI] [PubMed] [Google Scholar]
- Tanaka T, Zhou Y, Ozawa T, Okizono R, Banba A, Yamamura T, Oga E, Muraguchi A, and Sakurai H (2018). Ligand-activated epidermal growth factor receptor (EGFR) signaling governs endocytic trafficking of unliganded receptor monomers by non-canonical phosphorylation. J. Biol. Chem. 293, 2288–2301. 10.1074/jbc.m117.811299. [DOI] [PMC free article] [PubMed] [Google Scholar]
- Tong J, Taylor P, and Moran MF (2014). Proteomic analysis of the epidermal growth factor receptor (EGFR) interactome and post-translational modifications associated with receptor endocytosis in response to EGF and stress. Mol. Cell. Proteomics 13, 1644–1658. 10.1074/mcp.m114.038596. [DOI] [PMC free article] [PubMed] [Google Scholar]
- von Zastrow M, and Sorkin A (2021). Mechanisms for regulating and organizing receptor signaling by endocytosis. Annu. Rev. Biochem. 90, 709–737. 10.1146/annurev-biochem-081820-092427. [DOI] [PMC free article] [PubMed] [Google Scholar]
- Watkins SC, and Cullen MJ (1986). A quantitative comparison of satellite cell ultrastructure in Duchenne muscular dystrophy, polymyositis, and normal controls. Muscle Nerve 9, 724–730. 10.1002/mus.880090808. [DOI] [PubMed] [Google Scholar]
- Wenzel EM, Schultz SW, Schink KO, Pedersen NM, Nähse V, Carlson A, Brech A, Stenmark H, and Raiborg C (2018). Concerted ESCRT and clathrin recruitment waves define the timing and morphology of intraluminal vesicle formation. Nat. Commun. 9, 2932. 10.1038/s41467-018-05345-8. [DOI] [PMC free article] [PubMed] [Google Scholar]
- Witte K, Schuh AL, Hegermann J, Sarkeshik A, Mayers JR, Schwarze K, Yates III JR, Eimer S, and Audhya A (2011). TFG-1 function in protein secretion and oncogenesis. Nat. Cell Biol. 13, 550–558. 10.1038/ncb2225. [DOI] [PMC free article] [PubMed] [Google Scholar]
Associated Data
This section collects any data citations, data availability statements, or supplementary materials included in this article.
Supplementary Materials
Data Availability Statement
All data generated and analyzed in this study are available from the corresponding author on reasonable request. This paper does not report original code. Any additional information required to reanalyze the data reported in this paper is available from the lead contact upon request.
Source data for mass spectrometry analyses has been deposited to the ProteomeXchange Consortium via the PRIDE partner repository with the dataset identifier Database: PXD030072. The interactive viewer is available at https://wren.hms.harvard.edu/egfr/.