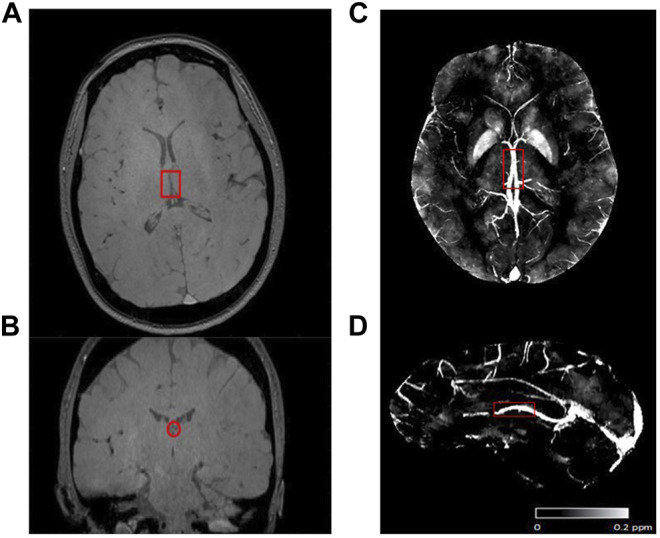
FIGURE 1.

Representative image and region of the internal cerebral vein (ICV, highlight by red rectangle). (A) Magnitude in axial view. (B) Magnitude in coronal view. (C) Axial view, and (D) Sagittal view of ROI in the max intensity projection of a representative susceptibility map.
