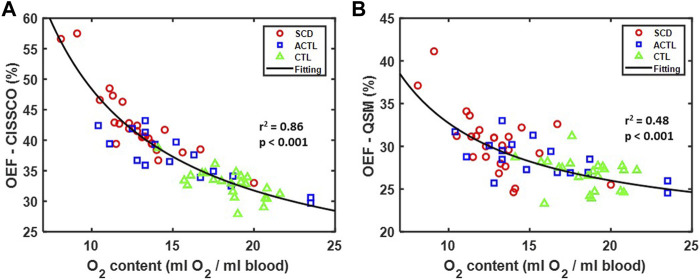
FIGURE 4.
Relationship between OEF and O2 content in SCD, ACTL and CTL. (A) Scatterplot between OEF-CISSCO and O2 content. The fitting reciprocal line is shown in black with r 2 = 0.86, p < 0.001. (B) Scatterplot between OEF-QSM and O2 content. The fitting reciprocal line is shown in black with r 2 = 0.48, p < 0.001.

