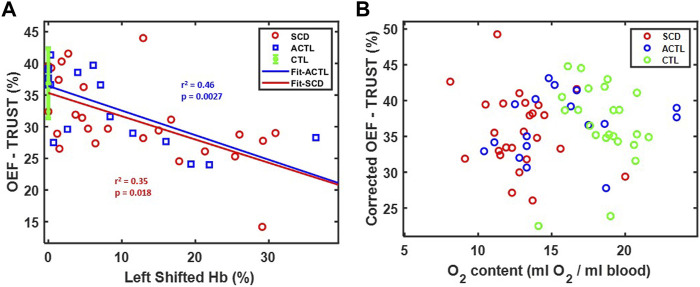
FIGURE 5.
(A) Relationship between OEF-TRUST with left shifted hemoglobin. Linear correlations are shown in blue line (r 2 = 0.46, p = 0.0027) for ACTL and red line (r 2 = 0.35, p = 0.0018) for SCD. The control group is shown as 36.8 ± 5.5 (mean ± std) in green. (B) Relationship between corrected OEF-TRUST with O2 content.

