Fig. 2.
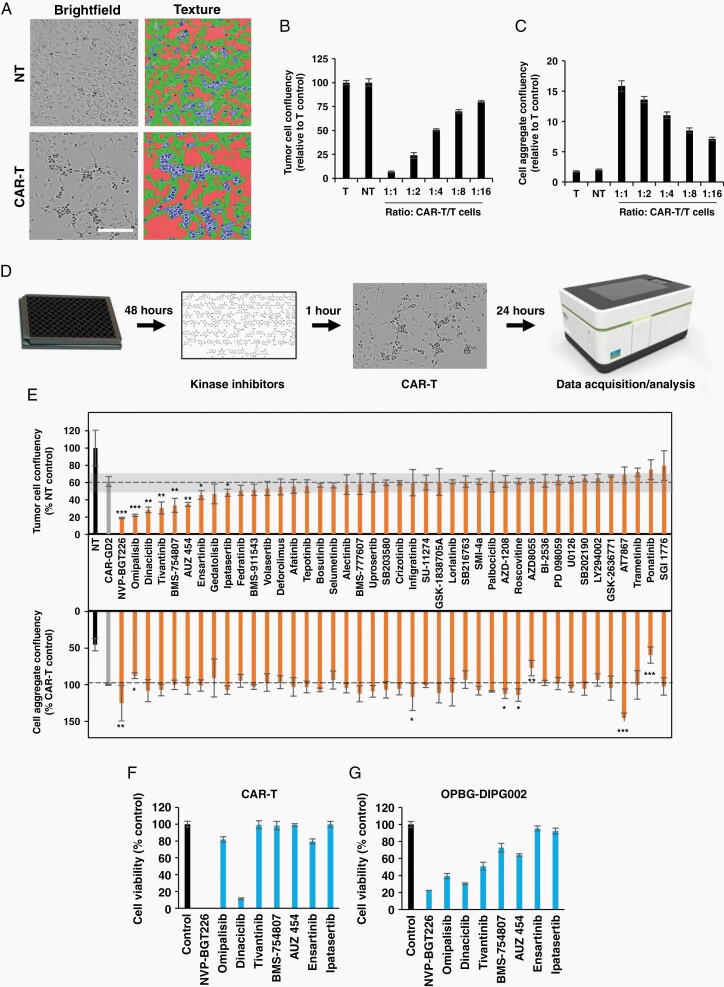
Drug screening to identify modulators of GD2-CAR T-cells anti-tumor activity. (A) Brightfield images of OPBG-DIPG002 cells cocultured with CAR-T or (NT T-cells acquired and analyzed with Operetta CLS. DIPG cells (green), aggregated cells (blue), and empty space (red) are segmented. Scale bar = 100 µm. (B–C) Confluency quantification for OPBG-DIPG002 (B) and aggregated cells (C) in different CAR T-cells/DIPG cell ratios. (D) High-throughput cell-based assay workflow. (E) Results of the drug screen performed with 42 kinase inhibitors: Tumor (upper panel) and aggregated cell (lower panel) confluency. The 10% cutoff is indicated in gray. (F–G) Cell viability of CAR T-cells (F) and OPBG-DIPG002 cells (G) after 24 h of incubation with compounds at 1 uM. Results are mean ± SD of n = 3.

