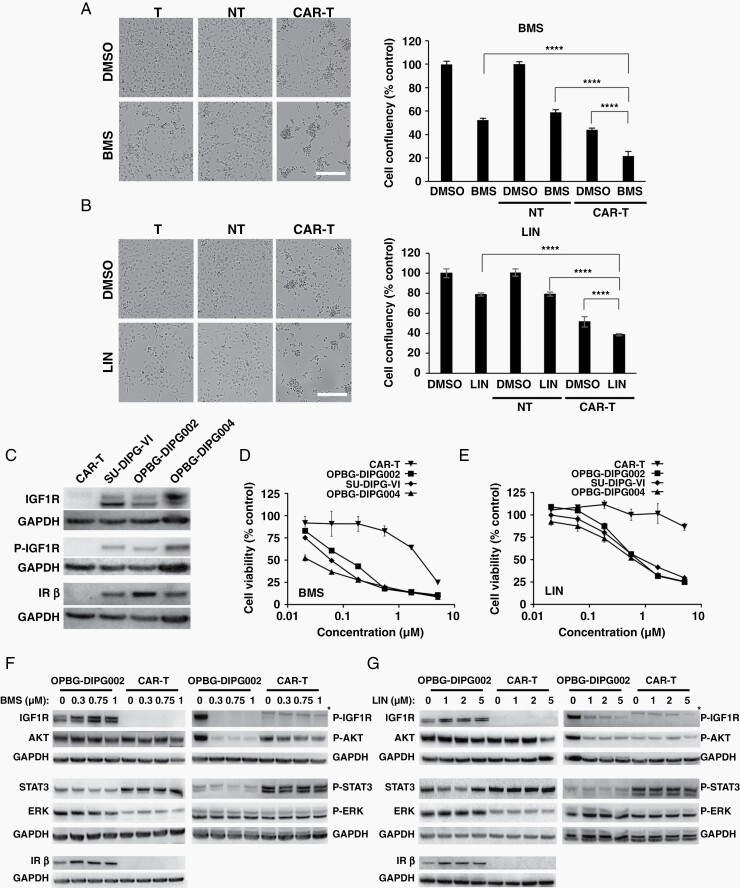
Fig. 3.
IGF1R/IR pathway inhibition affects DIPG, but not GD2-CAR T-cells. (A–B) Brightfield images and corresponding cell confluency quantification of OPBG-DIPG002 cells treated with BMS (A) (0.75 µM) or LIN (B) (5 µM) alone and with CAR or NT T-cells. DMSO was used as vehicle control. Scale bar = 100 µm. (C) Western blot analysis of the indicated protein in DIPG and CAR T-cells. (D–E) Dose-response curves for BMS and LIN with the indicated cells. Results are mean ± SD from 1 representative of 3 experiments; n = 3 replicates. (F–G) Western blot analysis for the indicated proteins in OPBG-DIPG002 and CAR T-cells treated with BMS (F) or LIN (G). *nonspecific signal.

