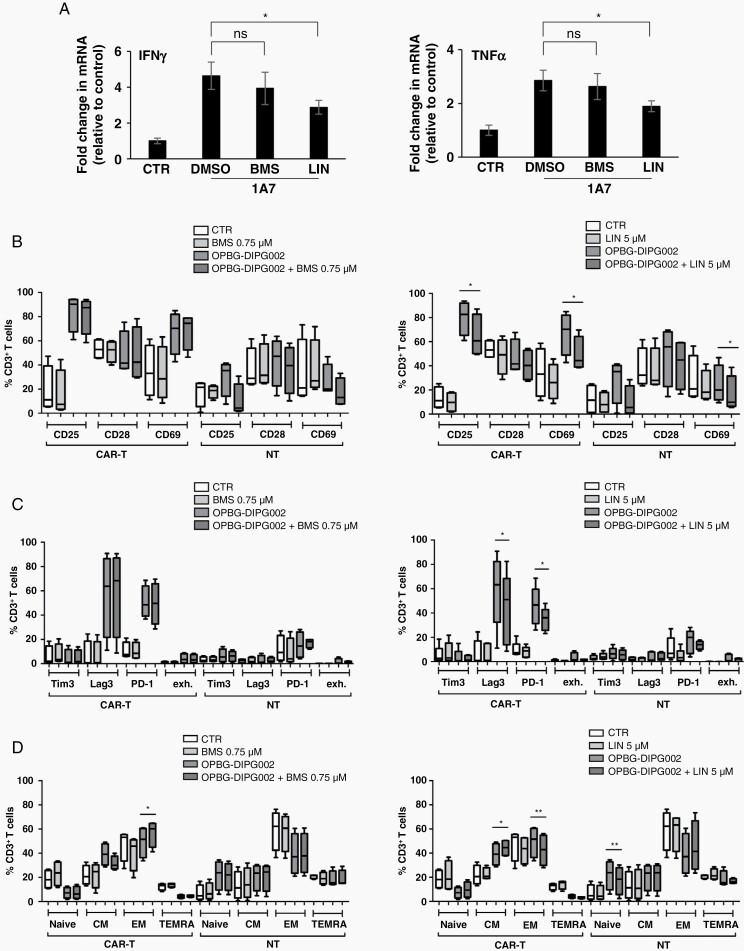
Fig. 4.
Effect of BMS and LIN treatments on GD2-CAR T-cell phenotypes. (A) IFNα (left panel) and TNFγ (right panel) mRNA levels in 1A7-activated CAR-T cells treated with BMS, LIN, or DMSO as vehicle control. Data are normalized to the nonactivated CAR-T cells (CTR). Results are presented as mean ± SD of 3 independent repeats. (B–D) Box-plots representating activation (B), exhaustion (C), and memory (D) profiles of CAR or NT T-cells in coculture for 96 h with or without OPGB-DIPG002, in presence of LIN (left panel) or BMS (right panel). Results are presented as mean ± SD from 4 donors.

