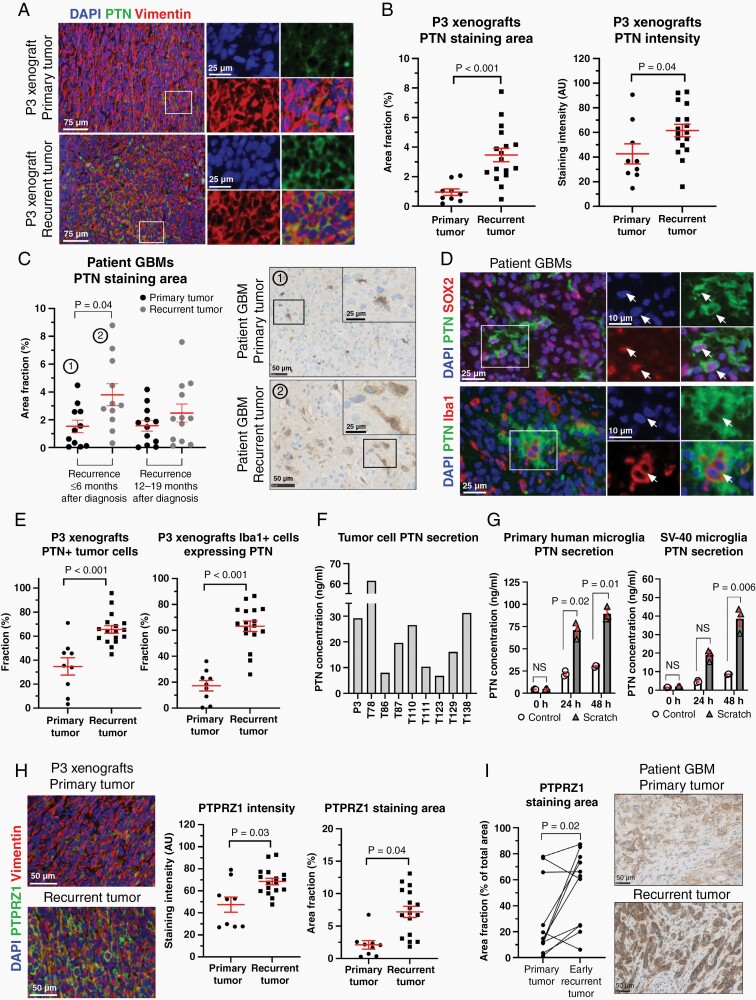
Fig. 4.
PTN expression is found in both tumor cells and tumor-associated microglia/macrophages and increases in recurrent tumors. (A) Representative immunofluorescence images showing PTN expression in primary vs recurrent P3 xenografts. Scale = 75 µm (overview) and 25 µm (inserts). (B) Quantification of PTN expression in primary (n = 9) vs recurrent (n = 17) xenografts. (C) Quantification of PTN expression in patient GBMs validated PTN upregulation in early recurrent tumors. Scale = 50 µm (overview) and 25 µm (inserts). (D) PTN protein expression was seen both in SOX2+ GSCs and tumor-associated microglia/macrophages (white arrows). Scale = 25 µm (overview) and 10 µm (inserts). (E) Quantification of PTN-expressing tumor cells (vimentin+/PTN+) and microglia/macrophages (Iba1+/PTN+) in primary (n = 9) vs recurrent (n = 17) xenografts. (F, G) ELISA with 9 different patient-derived GBM spheroid cultures and primary human microglia as well as SV-40 microglia confirmed PTN secretion. (H, I) Quantification of PTPRZ1 expression in primary (n = 9) vs recurrent (n = 17) xenografts and primary (n = 11) vs early recurrent (n = 11) patient GBMs. Scale = 50 µm. AU = arbitrary units. Abbreviations: GBMs, glioblastomas; PTN, pleiotrophin.

