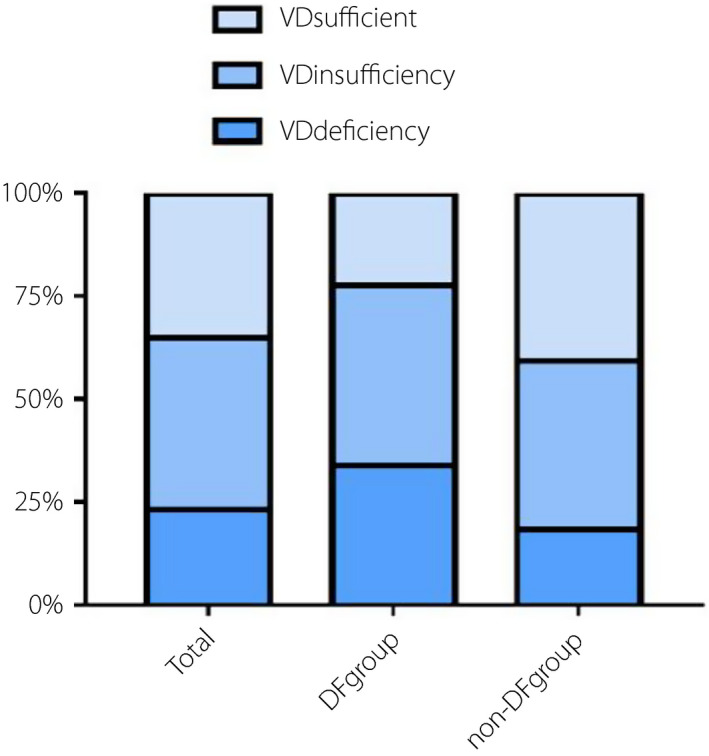
Figure 2.

Bar graphs show the prevalence rates of vitamin D sufficiency, insufficiency, and deficiency among groups. The rates of vitamin D sufficiency, insufficiency, and deficiency in the total population were respectively 35.04, 41.72, and 23.24%. The rates of vitamin D sufficiency, insufficiency, and deficiency in diabetic foot group were respectively 22.49, 43.69, and 33.82%. The rates of vitamin D sufficiency, insufficiency, and deficiency in non‐DF group were respectively 40.80, 40.80, and 18.40%.
