
Figure 3.
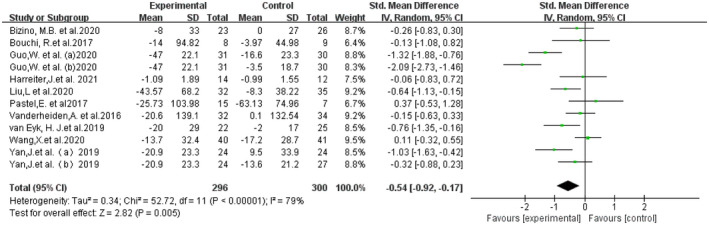
Forest plot comparing the post‐treatment visceral adipose tissue (VAT) of the control and glucagon‐like peptide‐1 receptor agonist (GLP‐1RA) groups.
Official websites use .gov
A
.gov website belongs to an official
government organization in the United States.
Secure .gov websites use HTTPS
A lock (
) or https:// means you've safely
connected to the .gov website. Share sensitive
information only on official, secure websites.
Forest plot comparing the post‐treatment visceral adipose tissue (VAT) of the control and glucagon‐like peptide‐1 receptor agonist (GLP‐1RA) groups.