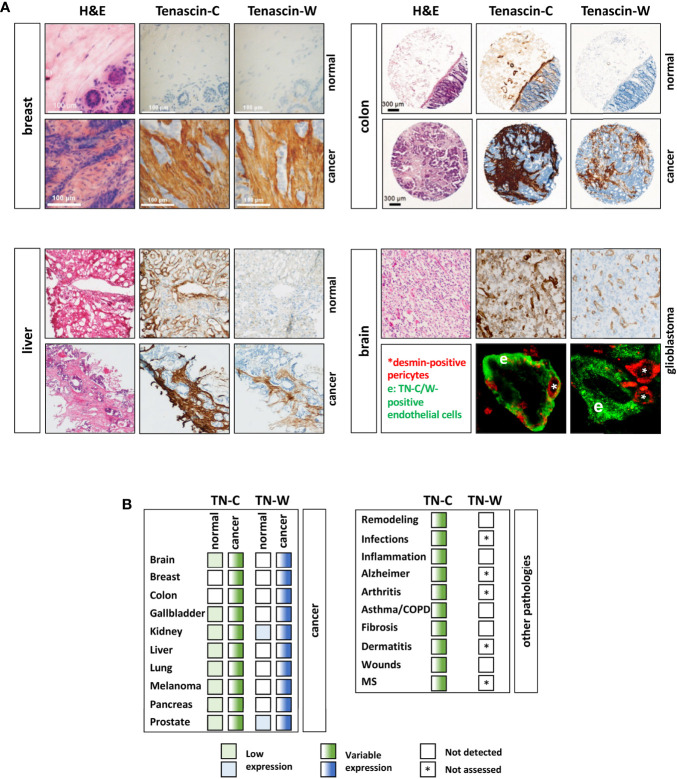
Figure 4.
TN-C and TN-W expression in human cancers. (A) Examples of immunohistochemical analyses of TN-C and TN-W in human breast, liver, and colorectal cancer as well as in adjacent normal tissues. Note that while TN-W is not expressed in healthy tissues, TN-C is detectable in colon and liver. In glioblastoma TN-C and TN-W show strong expression around vessel-like structures (top). Double immunofluorescence staining of TN-W or TN-C (green) with desmin (red) shows that TN-C encloses all pericytes, while TN-W staining is adjacent to them. Original images of breast tissue from Degen et al. (88), of liver tissue from Hendaoui et al. (89), of colon tissue from Degen et al. (52), and of brain tissue from Martina et al. (90) with permission. (B) Table of all cancer/normal tissues that have been analyzed so far for TN-W and TN-C by immunohistochemistry and/or immunoblotting (left). Right table shows non-cancerous conditions with TN-C upregulation and non-detectable (white box) TN-W expression. Fully colored boxes: expressed; gradient-colored boxes: variable expression ranging from low (light) to high (dark). * not assessed yet; MS, multiple sclerosis.

