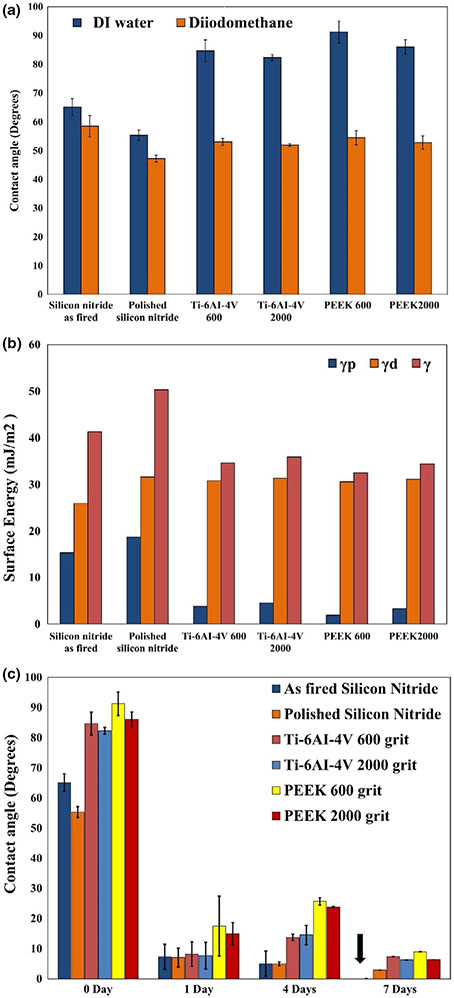
FIGURE 4.
Shows variation in contact angle on samples surface with water and DIM with error bars showing standard deviation (a), the calculated surface energy (γ) for all samples, broken into polar γp and dispersive γd components (b), and (c) indicates the variation in contact angle of DI water on the sample surface before and after immersion for 1, 4 and 7 days in α-MEM showing increasing in the hydrophilicity of the sample surface, and error bars showing the standard deviation

