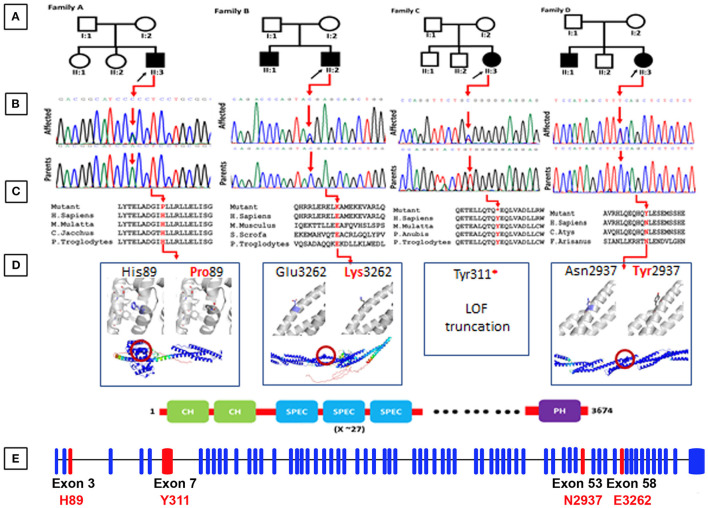
Figure 1.
(A) Representing pedigrees of all the four families (A–D). (B) Showing Sanger sequencing electro-grams of all the four families. (C) Conservation analysis of the mutations identified in the present studies along different species. (D) Structural models of the CH1 domain containing the His89Pro mutation, and the spectrin repeats containing the Asn2937Tyr and Glu3262Lys mutations. Three 1,000 segments containing the residues of interest were modeled with AlphaFold, and are shown in the bottom as cartoons, colored by pLDDT score. Residues with pLDDT <50 are colored red, representing regions with low confidence, and residues with pLDDT>90 are blue, showing high-confidence segments. The top insets show a zoom into the local region of each mutated residue (shown as blue sticks), and the comparison between the wild-type and mutated states. The residues predicted to interact with His89 are shown as gray sticks. (E) Exon organization of SPTBN5. Boxes are exons. Lines connecting the boxes are introns. Filled boxes are coding sequence, and empty, unfilled boxes are UTR (UnTranslated Region). Adapted from Ensembl (release 105) (Howe et al., 2021).

