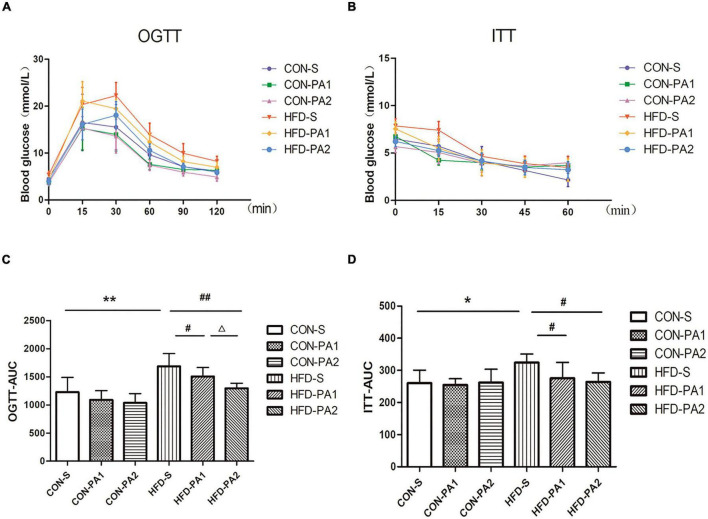
FIGURE 3.
Glucose change curves of OGTT and ITT. (A,C) OGTT in mice after fasting for 12 h. Histograms represent the areas under the glucose curve. (B,D) ITT in mice after fasting for 2 h. Histograms represent the areas under the glucose curve. Compared with the CON-S group, *P < 0.05 and **P < 0.01; compared with the HFD-S group, #P < 0.05 and ##P < 0.01; comparison between exercise groups (CON-PA1 vs. CON-PA2 and HFD-PA1 vs. HFD-PA2), ΔP < 0.05 and ΔΔP < 0.01.

