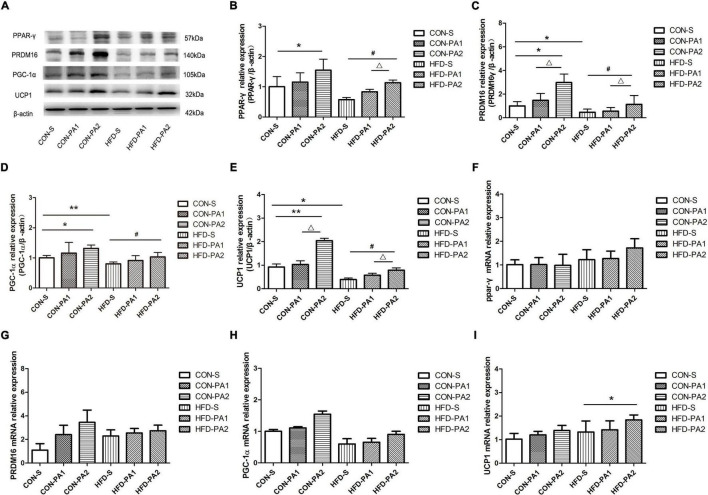
FIGURE 5.
Expression levels of browning-related proteins and genes in mice WAT. (A–E) Western blot analysis of protein PPAR-γ, PRDM16, PGC-1α, and UCP1 in subcutaneous adipose tissues. (F–I) Relative expression analysis results of PRDM16, PPAR-γ, PGC-1α, and UCP1 genes, respectively. Compared with the CON-S group, *P < 0.05 and **P < 0.01; compared with the HFD-S group, #P < 0.05 and ##P < 0.01; comparison between exercise groups (CON-PA1 vs. CON-PA2, HFD-PA1 vs. HFD-PA2), ΔP < 0.05 and ΔΔP < 0.01.

