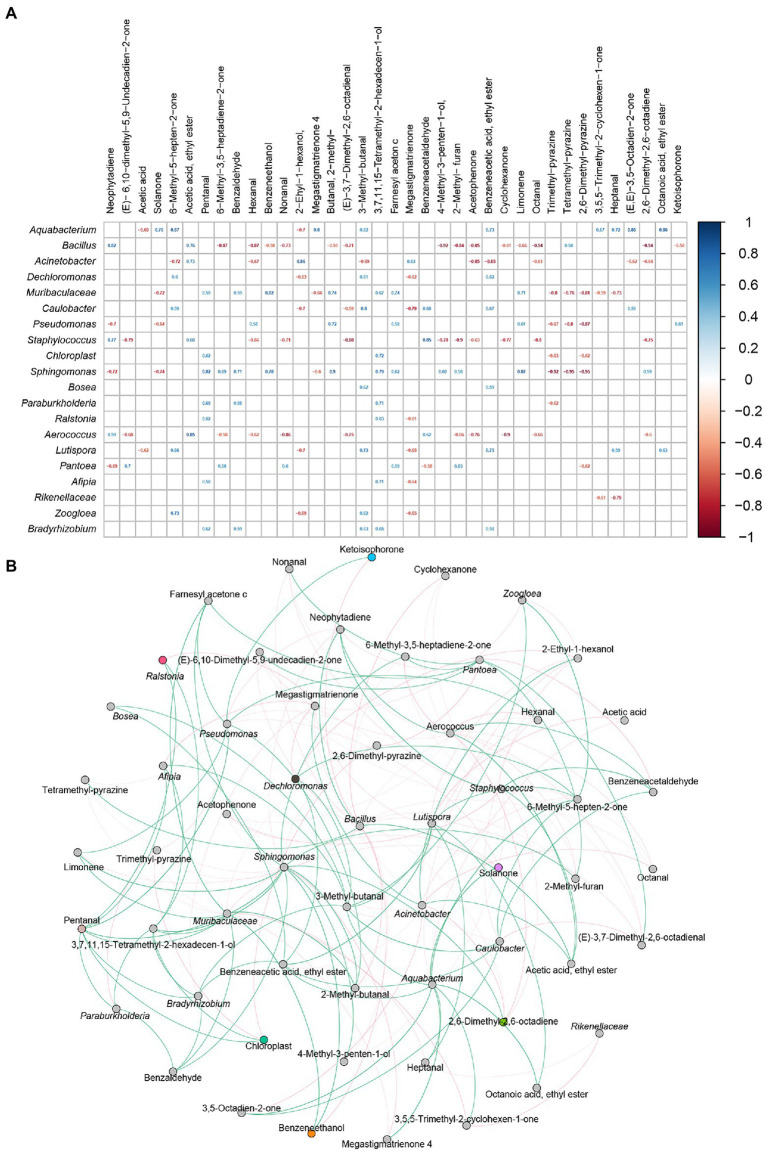
Figure 8.
The correlation between bacterial community and volatile flavor compounds. Heatmap analysis based on Spearman’s correlation coefficients between representative bacteria and core volatile flavor compounds (A). Co-occurrence networks of representative bacterial taxa and core volatile flavor compounds. Green line means positive correlation; red line means negative correlation (B).

