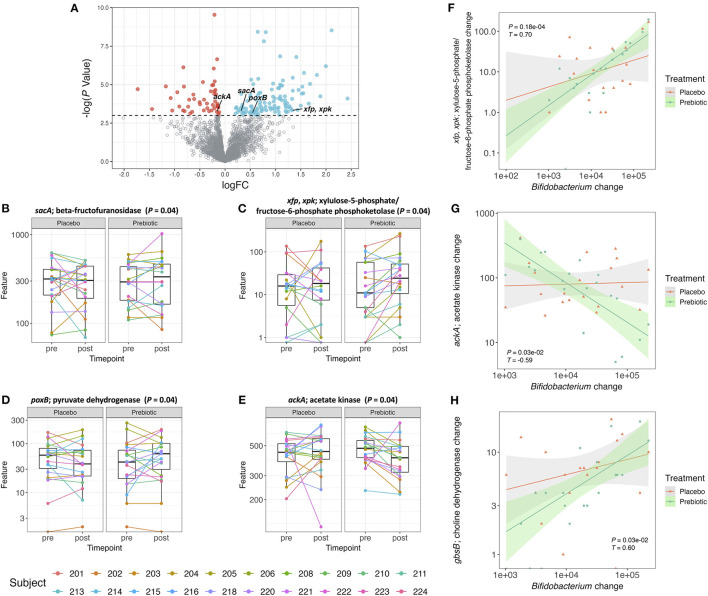
Figure 3.
(A) Volcano plot of all detected genes. Genes with a logFC (post–pre treatment) > 0 and a –log(P-value) > 0.05 are colored blue and genes with a logFC <0 and a –log(P-value) > 0.05 are colored red. All the other genes are colored gray. (B–E) Box plot of gene counts pre- and post-treatment with placebo or prebiotic (P ≤ 0.05, unadjusted). (F–H) Correlation plot of changes (post–pre) in Bifidobacterium abundance against changes (post–pre) in gene counts for both placebo and prebiotic in 20 subjects (prebiotic: P ≤ 0.05, adjusted, Kendall T).

