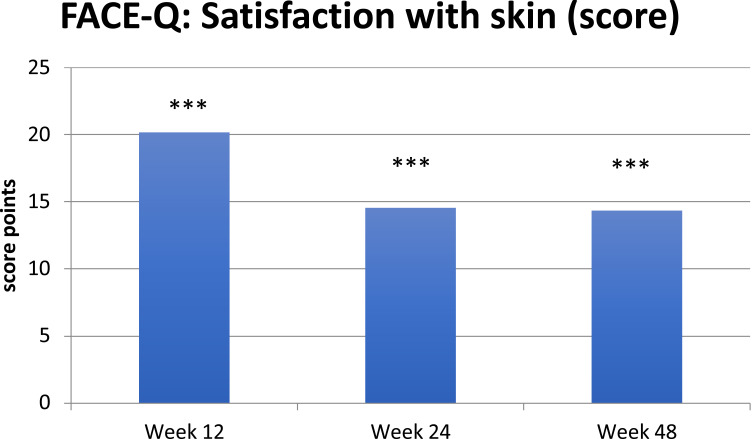
Figure 4.
FACE-QTM Data evaluated by questionnaire “Satisfaction with skin” was assessed at Baseline, week 12, 24 and 48. Figure 4 shows change from baseline. Week 12 shows 20.2, week 24 shows 14.6 and week 48 shows 14.4 score points improvement vs baseline. Statistical significance at all timepoints: *** p < 0.001. Table S2 in the supplementary Document provides the full data set.

