Figure 2.
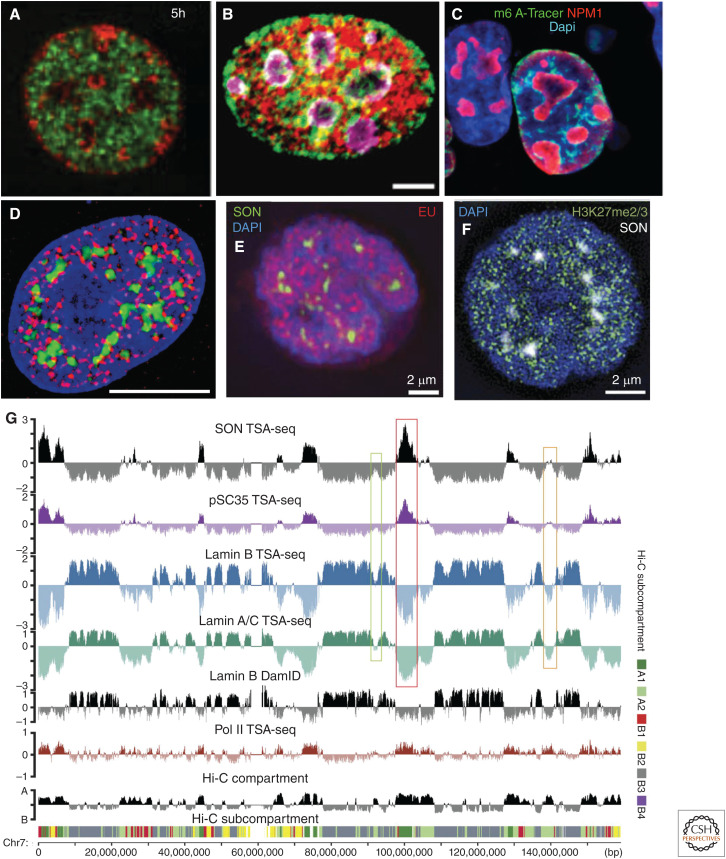
Both imaging and sequencing-based genomics methods suggest binary model for nuclear genome organization as a first approximation to a more complex organization. (A–C) An approximately binary nuclear genome organization revealed by imaging L1 repeat enriched chromatin, late-replicating DNA, and lamina-associated domains (LADs) largely at the nuclear and nucleolar peripheries with B1/Alu repeat enriched chromatin, early-replicating DNA, and intervening LADs (iLADs) in the nuclear interior. (A) Mouse embryonic fibroblast, early (green) versus late (red) DNA replication pulse labeling (5 h chase between early and late labeling). (Panel A from Wu et al. 2006; reprinted, with permission, from The Rockefeller Press © 2006.) (Continued) (B) Mouse C2C12 cell. L1 (green) or B repeat (red) FISH with nucleoli stained by nucleolin (purple). Scale bar, 5 μm. (Panel B from Lu et al. 2021; reprinted under the terms of the Creative Commons CC BY license.) (C) LADs, whose DNA was methylated by contact with lamin B1 fused to Dam methylase in the preceding interphase, stochastically redistribute early in the next interphase to the nuclear lamina, periphery of the nucleoli (red, NPM1), and nuclear interior (blue, DAPI), as visualized by the binding of the m6A-Tracer protein (green) that binds methylated DNA. (Panel C from Kind et al. 2013; reprinted, with permission, from Elsevier © 2013.) (D–F) Signs of a more complex nuclear genome organization emerge after staining for nuclear speckles and various marks of active versus repressive chromatin. (D) Hyperacetylated histones (red) are distributed nonuniformly within nuclear interior (DNA, blue), including concentrations adjacent to nuclear speckles (green). Scale bar, 10 μm. (Panel D from Hendzel et al. 1998; reprinted, with permission, from the American Society for Cell Biology © 1998.) (E,F) Local concentrations of EU pulse-labeling of nascent transcripts (red) revealing transcriptionally active chromosome regions dispersed nonuniformly through nuclear interior (DAPI, blue), including surrounding nuclear speckles (SON, green) (E); in contrast, repressive H3K27me3 mark (green) for facultative heterochromatin also is present in foci distributed throughout most of the nucleus from the nuclear periphery to the edge of nuclear speckles (F). (Panels E and F from Chen et al. 2018b; reprinted under the Creative Commons License CC BY-NC-SA 4.0.) (G) Genome browser view showing how largely binary division of nuclear genome organization based on lamin B1 DamID, Hi-C compartment (EV1) score, or RNA Pol II CTD Ser5p TSA-seq is further subdivided into chromosomal regions with varying distances to nuclear speckles or from nuclear lamina, as seen by varying location and heights/depths of SON/SC35 TSA-seq peaks/valleys, varying depths of lamin A/C and B TSA-seq valleys, as well as Hi-C subcompartments (note correlation of A1 subcompartment with SON/SC35 TSA-seq peaks and varied localization of B1 [enriched in H3K27me3 mark] along chromosome). (Panel G from Chen et al. 2018b; reprinted under the Creative Commons License CC BY-NC-SA 4.0.)

