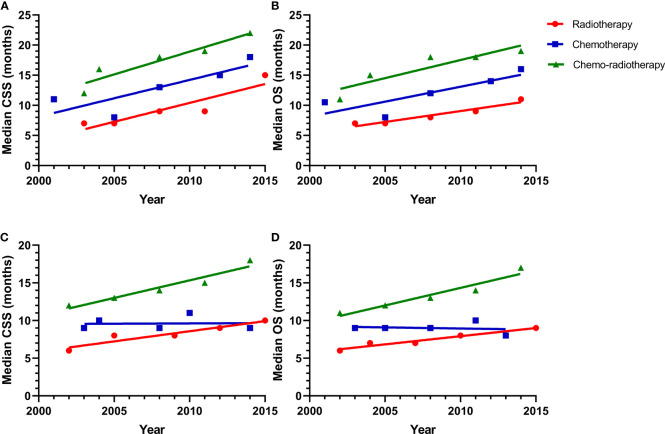
Figure 3.
(A) A linear regression model for median survival of CSS of patients with adenocarcinoma in the radiotherapy alone (r = 0.8304, P = 0.0313), chemotherapy alone (r = 0.7036, P = 0.0758), and chemo-radiotherapy groups (r = 0.8900, P = 0.0160); (B) A linear regression model for median survival of OS of patients with adenocarcinoma in the radiotherapy alone (r = 0.9268, P = 0.0086), chemotherapy alone (r = 0.7069, P = 0.0744), and chemo-radiotherapy groups (r = 0.8176, P = 0.0351); (C) A linear regression model for median survival of CSS of patients with non-adenocarcinoma in the radiotherapy alone (r = 0.8995, P = 0.0140), chemotherapy alone (r = 0.001392, P = 0.9525), and chemo-radiotherapy groups (r = 0.9245, P = 0090); (D) A linear regression model for median survival of OS of patients with non-adenocarcinoma in the radiotherapy alone (r = 0.9503, P = 0.0048), chemotherapy alone (r = 0.02941, P = 0.7827), and chemo-radiotherapy groups (r = 0.9245, P = 0.0090).

