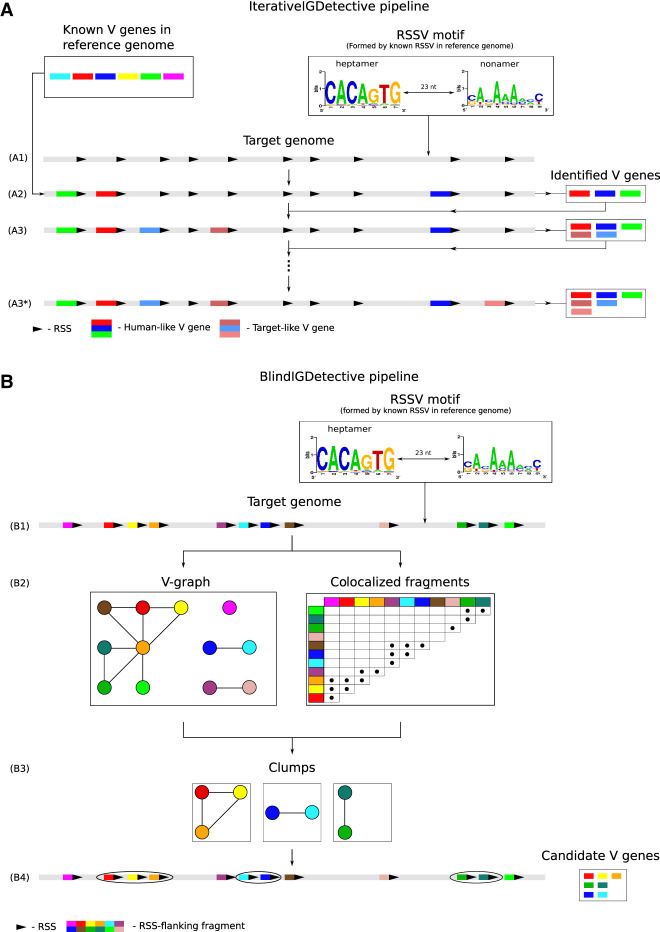
Figure 1.
IterativeIGDetective (A) and BlindIGDetective (B) pipelines. (A) IterativeIGDetective iteratively extends the set of identified IGHV genes. The “known V genes” box represents known V genes in a reference genome; the “RSSV motif” box represents a profile formed by the reference RSSVs for human V genes. (A1) After identifying a contig containing the IGH locus in the target genome, IterativeIGDetective identifies candidate RSSs for V genes in this contig based on similarities with the human RSS motif. A region preceding a true-positive RSS represents a V gene, whereas a region preceding a false-positive RSS does not. (A2) A region preceding a candidate RSS is classified as a human-like V gene if its similarity with a known human V gene exceeds a similarity threshold. (A3) Target-like V genes in the target genome are identified based on similarities with human-like V genes detected in step (A2). (A3*) Target-like V genes are iteratively identified based on previously detected target-like V genes until no new genes are identified. (B) BlindIGDetective constructs the V-graph, analyzes connected components in this graph, finds clumps of colocalized fragments in each connected component of this graph, and combines the found clumps into clusters that represent candidate families of V genes. (B1) Candidate RSSVs in the entire target genome are identified based on similarities with the human RSSV motif for V genes formed by the reference human RSSVs (represented by the “RSSV motif” box). (B2) The V-graph is constructed on the vertex-set of all RSSVs. Two vertices (RSSVs) in the V-graph are connected by an edge if fragments preceding these RSSVs are similar. True (false)-positive RSSVs form large (small) connected components in the V-graph. (B3) Each connected component in the V-graph is partitioned into clumps of colocated genes. (B4) Nontrivial clumps (containing multiple RSSs from the same connected component and clustered within a short region of the genome) represent putative V genes within putative IG loci. Note that a vertex is not included in a clump if it is not similar to all other vertices in this clump (like the light green vertex in the rightmost clump). At the final step (not shown), BlindIGDetective combines the identified clumps into clusters to reveal IG genes.

