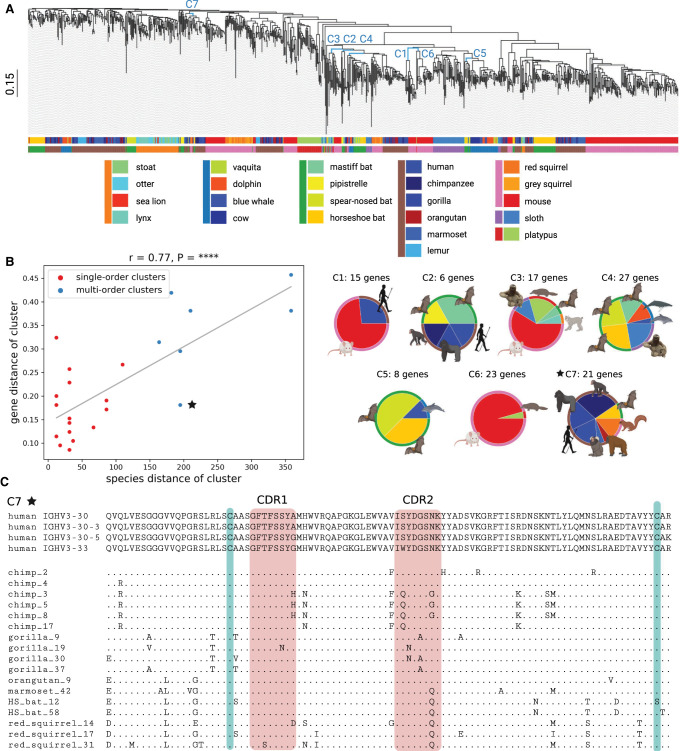
Figure 3.
Comparative analysis of mammalian IGHV genes. (A) A phylogenetic tree of IGHV genes in 20 target (581 V genes) and three reference (310 V genes) species. Edges corresponding to clusters C1–C7 described in B are shown in blue. The scale is shown on the left. The upper and lower horizontal bars show colors of species and their orders, respectively. A list of species and their colors is specified below the tree (species from the same order are shown by a colored vertical bar on the left). (B) The plot on the left shows the species distance (x-axis) and the gene distance (y-axis) for 25 large multispecies clusters of V genes. Red and blue dots correspond to single-order and multiorder clusters, respectively. The linear regression line is shown in grey. The Pearson's correlation (r) and P-value (P) are shown on the top of the plot. Each of seven multiorder clusters C1–C7 is represented as a pie chart on the right. An inner (outer) wedge in each pie chart corresponds to a species (an order), and the wedge size is proportional to the number of V genes it contains. (C) Multiple alignment of 21 V genes from the cluster C7. Four human V genes from this cluster are shown on the top. Nonhuman genes are denoted according to the short names of species, and “HS_bat” refers to the horseshoe bat. A position in a nonhuman V gene is shown by a “.” if the amino acid at this position matches the corresponding amino acid in one of four human V genes and by the corresponding amino acid otherwise. Red rectangles show the positions of CDR1 and CDR2 according to the IMGT notation. Green bars show positions of two conserved cysteines (one located close to the start of CDR1 and another located close to the end of the V gene).

