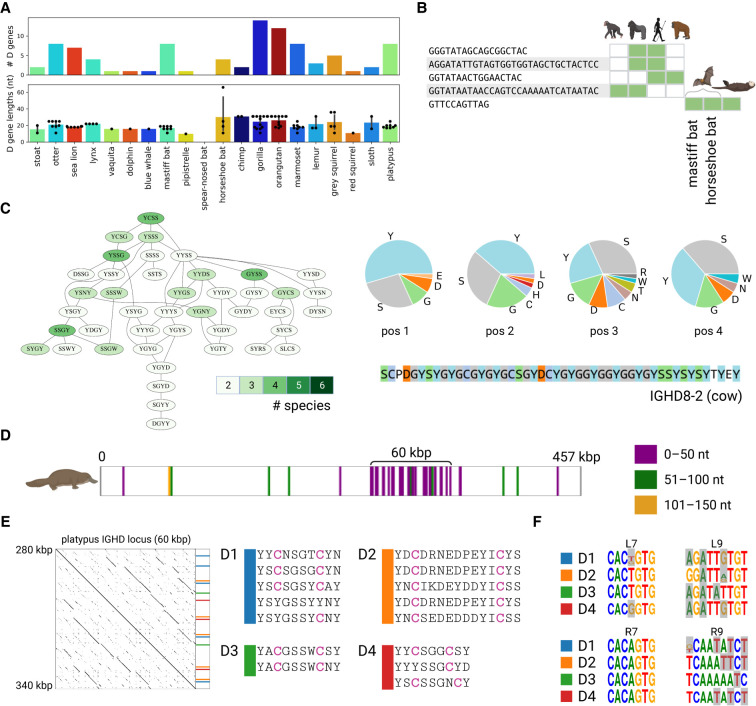
Figure 5.
Comparative analysis of D genes. (A) The distribution of the counts and lengths of D genes for 20 target species. (B) D genes shared among two or more reference and target species. Green cells show species containing the corresponding D gene candidates. Species from left to right: chimp, gorilla, human, orangutan, mastiff bat, horseshoe bat, and otter. (C) The largest connected component of the Hamming graph on amino acid 4-mers of D genes. The component is shown by the subgraph of the Hamming graph (left subpanel) and the amino acid content at each position of the 4-mer (right subpanel). Vertices of the Hamming graph are colored according to the number of species they represent: from two (pale green) to six (dark green). The amino acid sequence of the G/S/Y-rich cow D gene IGHD8-2 is shown on the bottom of the right subpanel. (D–F) Illustration of the analysis of D genes in the platypus genome. (D) Positions of D genes detected by SEARCH-D in the platypus IGH locus. D genes are colored according to their lengths: ≤50 nt (purple), 51–100 nt (green), and 51–150 nt (orange). (E) The dotplot on the left shows the alignment of the ≅60-kbp-long platypus IGHD locus against itself. Positions and sequences of genes from four D gene families with two cysteines are shown on the right. (F) Motif logos of RSSDleft heptamer (L7), RSSDleft nonamer (L9), RSSDright heptamer (R7), and RSSDright nonamer (R9) for families D1–D4. Positions that do not match nucleotides in the consensus RSSs computed using the combined references are highlighted in grey. Consensus RSSs for the combined reference are shown in Supplemental Figure S7.

