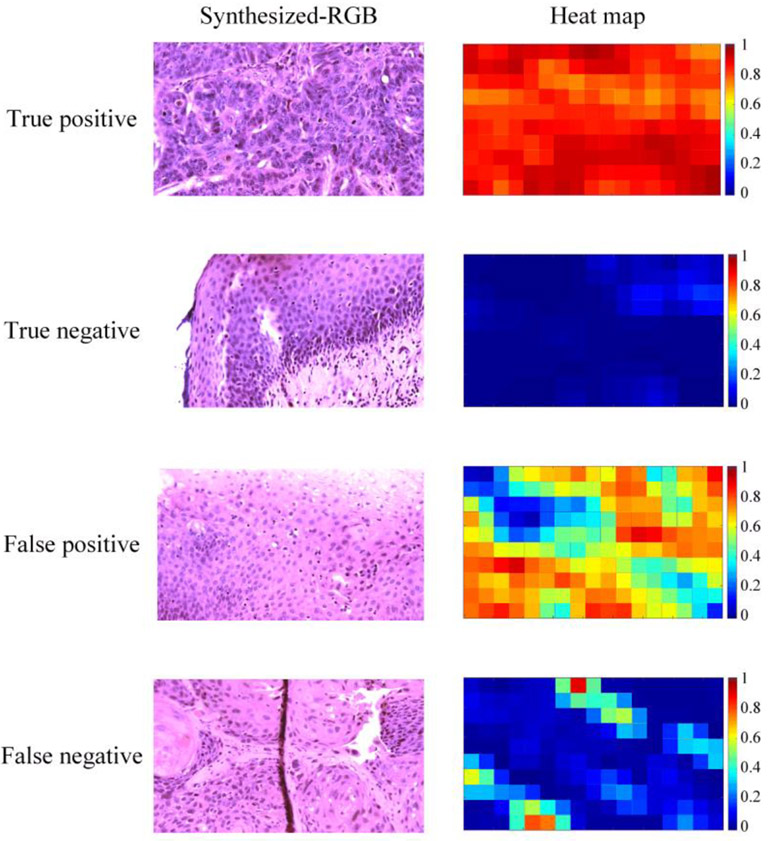
Figure 4.
Synthesized-RGB images and heat maps of true positive, true negative, false positive, and false negative. First row: a correctly classified whole image of cancerous tissue with keratinizing SCC and enlarged nuclei. Second row: a correctly classified whole image of normal epithelium, note that the small region on the top right comer was out of focus, which influenced the classification probability. Third row: normal epithelium with false positives due to fewer nuclei (top right) and dense nuclei (bottom left). Fourth row: tumor tissue with false negatives, probably due to the less distinct histologic features in the field of view.

