
Figure 2:
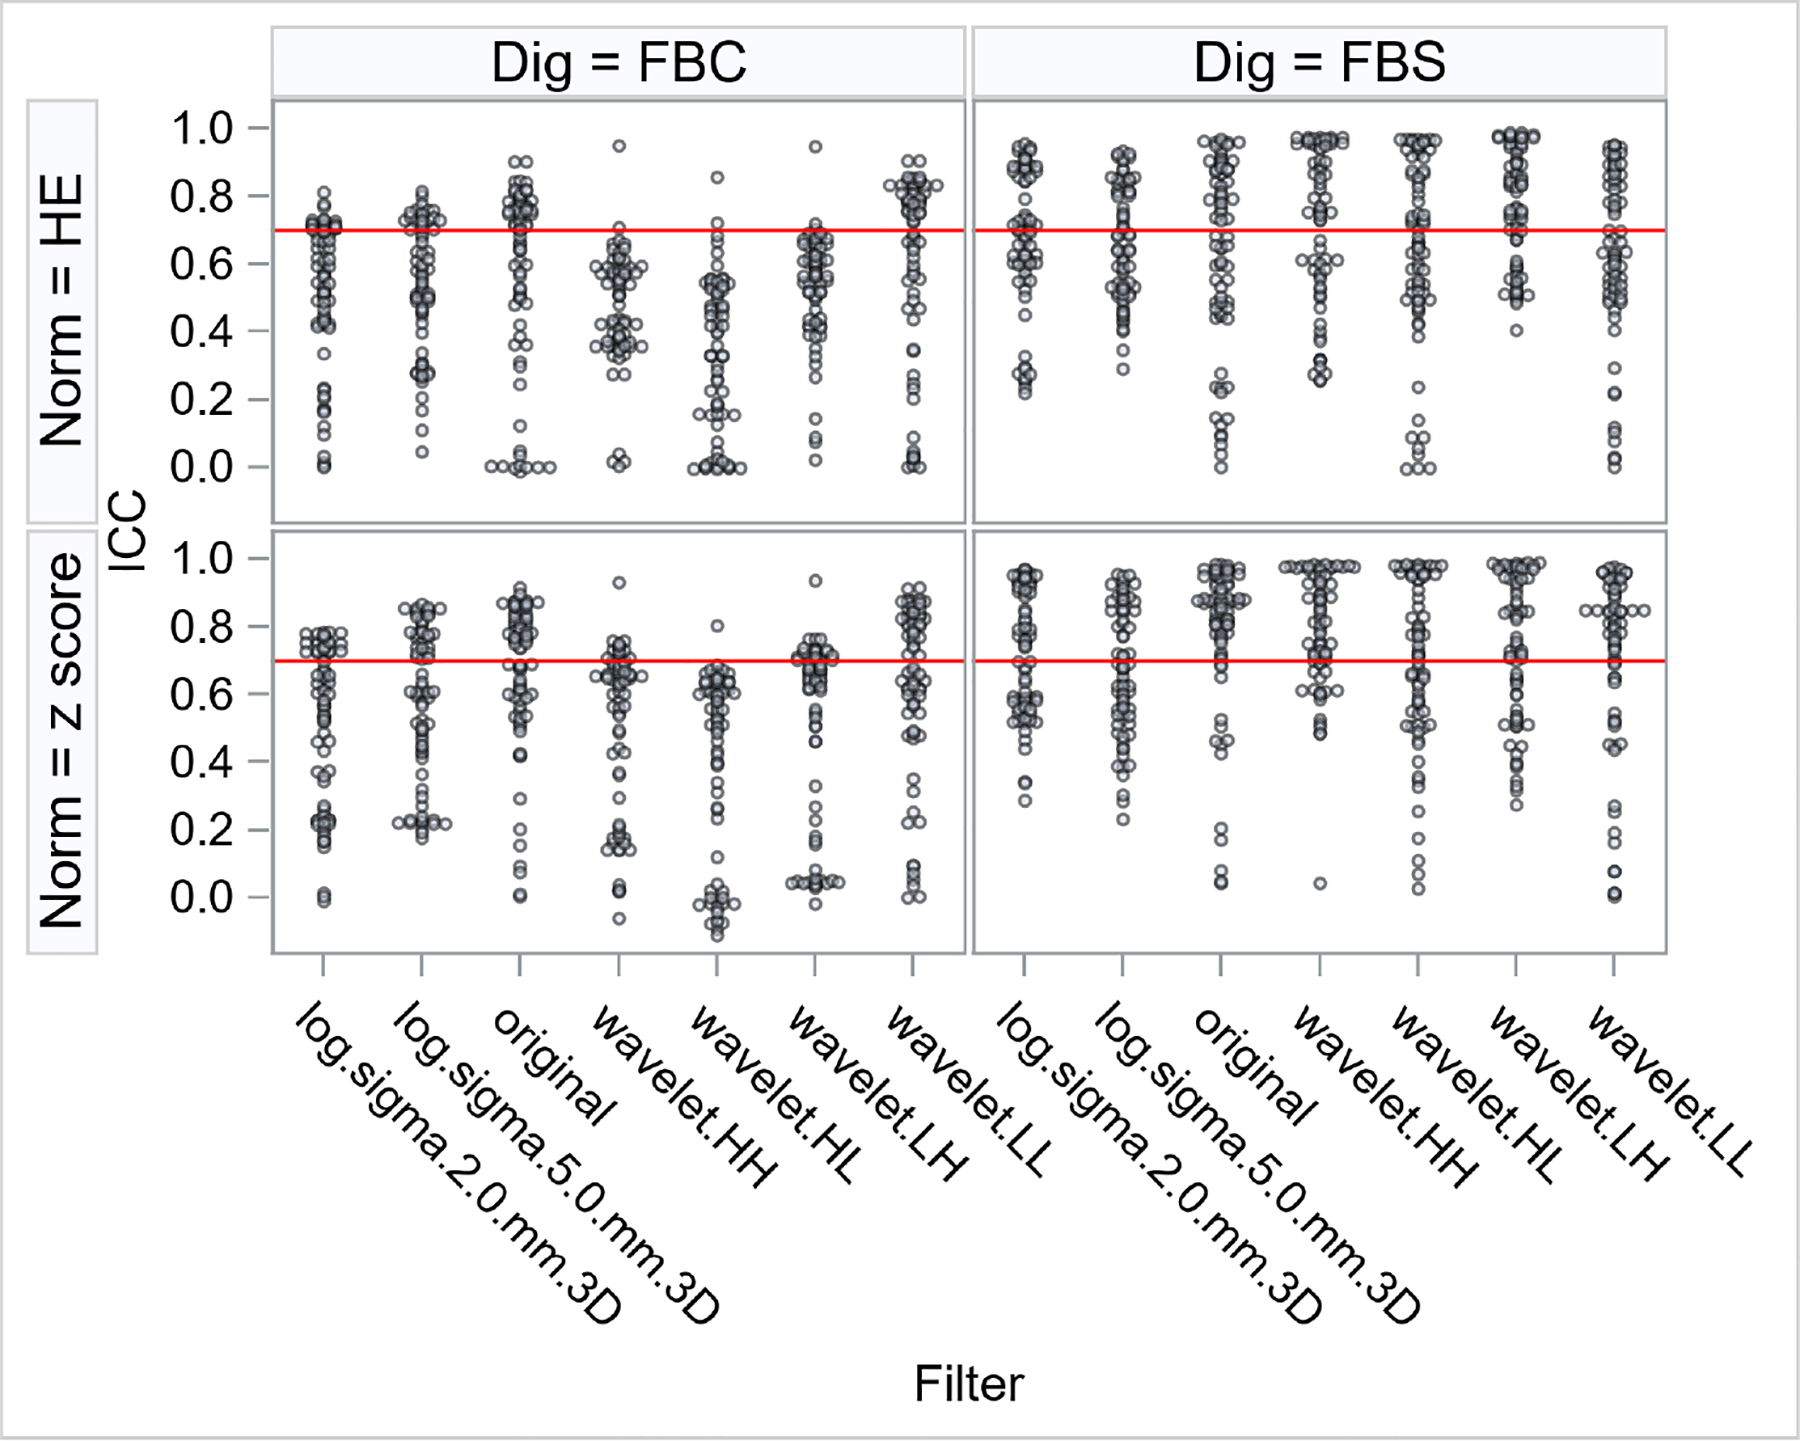
Distribution of intraclass correlation coefficients (ICC) of the texture features for different combinations of normalization (Norm = z score, histogram equalization (HE)), digitization (Dig = fixed bin count (FBC), fixed bin size (FBS)) and Filter (Laplacian of Gaussian (log), original, wavelet). Each point represents one radiomic texture feature under a certain normalization, digitization and filter combination. Red horizontal line represents the 0.7 cutoff for reproducibility.