
Figure 3. Forced dimerization of EGFR with other ERBB family members impart resistance to JBJ-09-063.
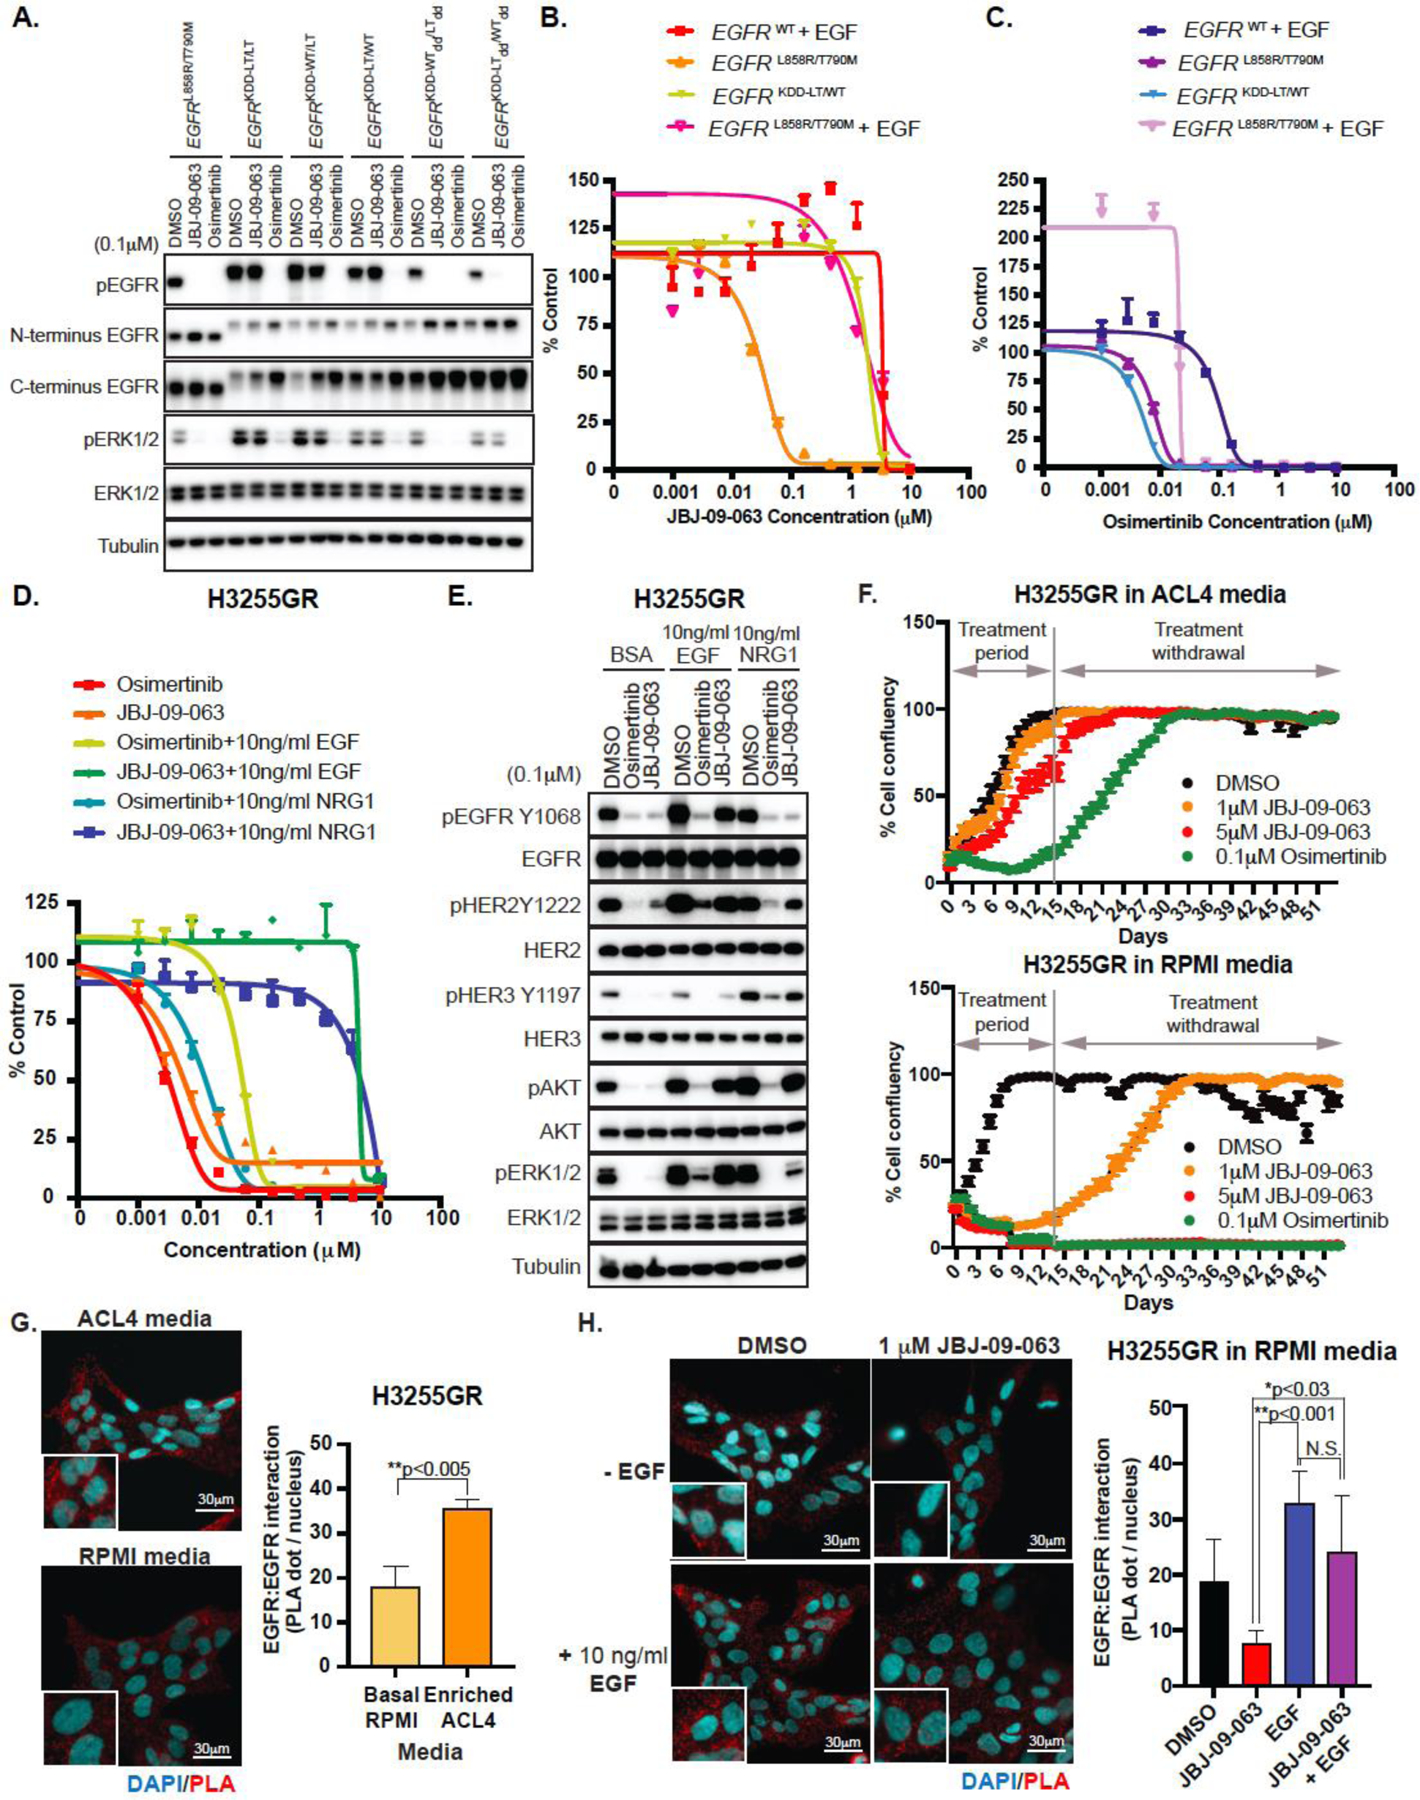
(A) Western Blot analyses of HEK293T/Cl.17 cells transiently transfected with EGFRL858R/T790M or with different EGFRKDD constructs and treated with DMSO, osimertinib or JBJ-09-063. Cell viability in EGFRWT, EGFRKDD-LT/WT, or EGFRL858R/T790M Ba/F3 cells in the presence or absence of EGF treated with increasing concentrations of (B) JBJ-09-063 or (C) osimertinib. (D) Cell viability and (E) Western Blot analyses of H3255GR cells cultured in RPMI media and treated with indicated concentrations of compounds in the presence or absence of EGF or NRG1. Cell viability assays shown in B-D were graphed as a percentage of activity relative to DMSO control over indicated concentrations. (F) Long-term cell growth assay measured as confluency (%) in H3255GR cells cultured in ACL4 media (top panel) versus RPMI media (bottom panel) and treated with DMSO, JBJ-09-063 or osimertinib for two weeks followed by drug withdrawal for an additional two weeks. Cell proliferation was graphed as a percentage relative to DMSO control. (G) Homodimerization of EGFR visualized by proximation ligation assay (PLA) in H3255GR cells cultured in ACL4 media or RPMI media. Statistical significance was determined using the unpaired t-test **P<0.005. (H) EGFR homodimerization in H3255GR cells cultured in RPMI media visualized by PLA after pre-treatment with or without 10 ng/ml of EGF for 15 minutes followed by incubation with DMSO or JBJ-09-063 for 4 hours. Nuclei are stained in cyan and distinct punctate dots in red are PLA signal showing interaction of EGFR homodimers. Statistical significance was determined by ANOVA followed by Tukey’s multiple comparisons test. *P<0.0278; **P<0.0014. Data quantification in 3D-E was performed and graphed as EGFR:EGFR interactions (PLA dot/nucleus) over different culture media. Scale bar = 30 µm. All studies shown here are representative experiments that were repeated at least three times.