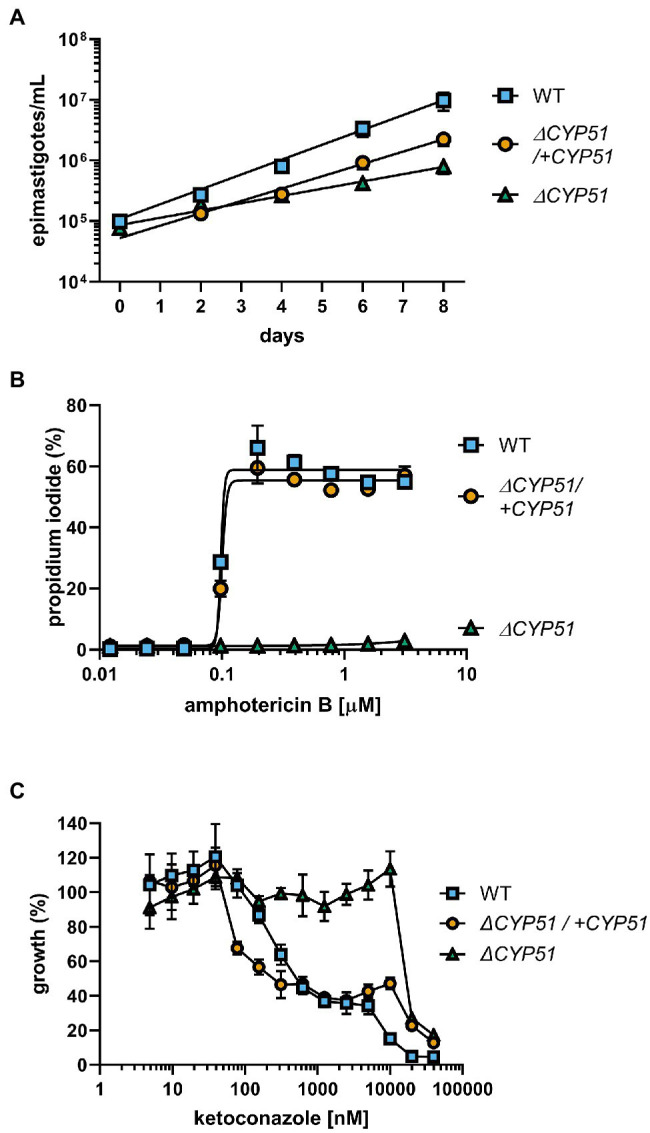
Figure 3.

(A) Enumeration of epimastigote concentration every 48 h starting at 1e5 epimastigotes/ml (n = 3), mean ± SD shown. WT epimastigotes exited the logarithmic phase of growth after day 8. (B) Measurement of epimastigote membrane integrity by flow cytometry using propidium iodide staining following incubation for 4 h with the indicated concentrations of amphotericin B (n = 3), mean ± SD shown. (C) Growth of epimastigotes (8 days) relative to samples without ketoconazole treatment, starting at 1e5 epimastigotes/ml (n = 3), mean ± SD shown.
