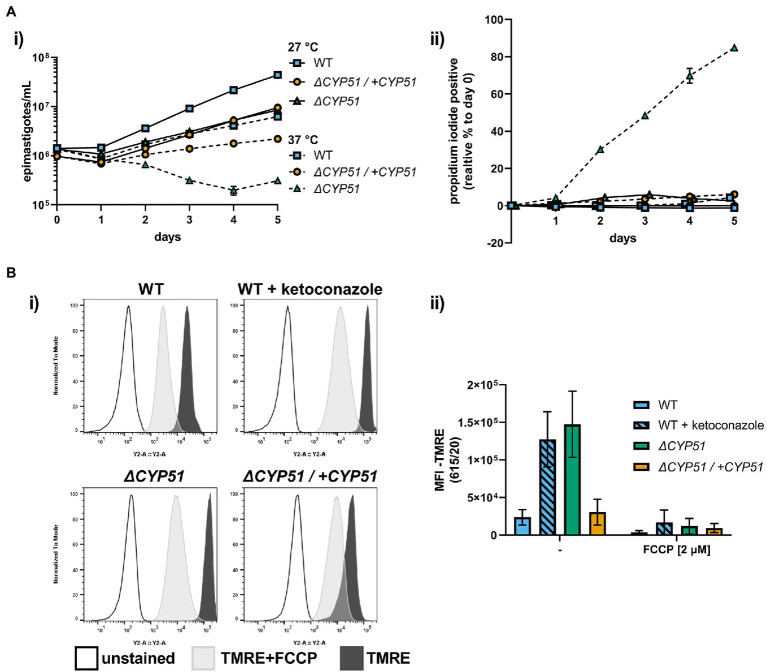
Figure 4.
(A) (i) Growth and (ii) membrane integrity of epimastigotes assessed daily during continual exposure to either 27°C or 37°C (n = 3), mean ± SD shown. (B) (i) Flow cytometry histograms of parasite fluorescence in the Y2 (615/20) channel. Unstained controls are shown along with TMRE stained parasites. (ii) Mean fluorescence intensity (MFI) in the Y2 channel with and without pre-treatment of parasites with FCCP, ±SD shown. Parasite line or ketoconazole treatment, FCCP treatment and interaction have p < 0.001 by two-way ANOVA; all multiple pairwise comparisons compared to WT are significant after Bonferroni correction.

