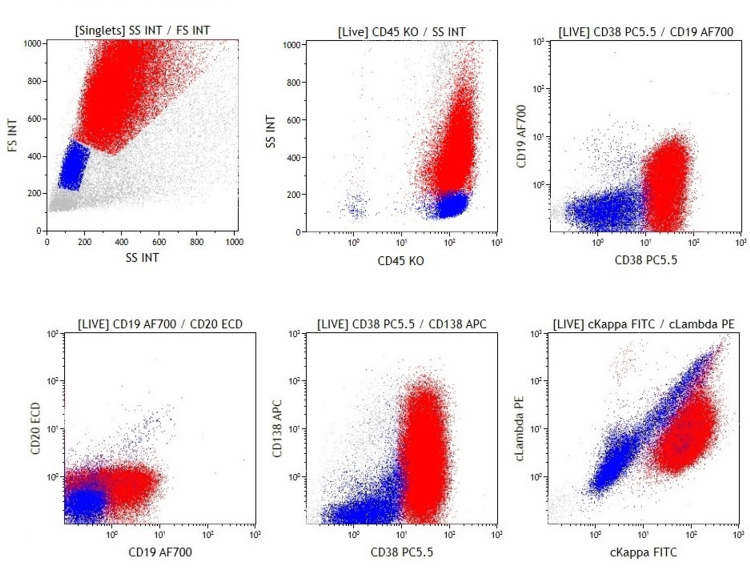
Figure 3. Primary effusion lymphoma (case 2).
Dot plots show a neoplastic population with high forward scatter and side scatter (red: abnormal population, blue: normal cells). The neoplastic lymphocytes are positive for CD45, CD38, and cytoplasmic kappa, and there is variable expression of CD19 and CD138. CD20 is negative.

