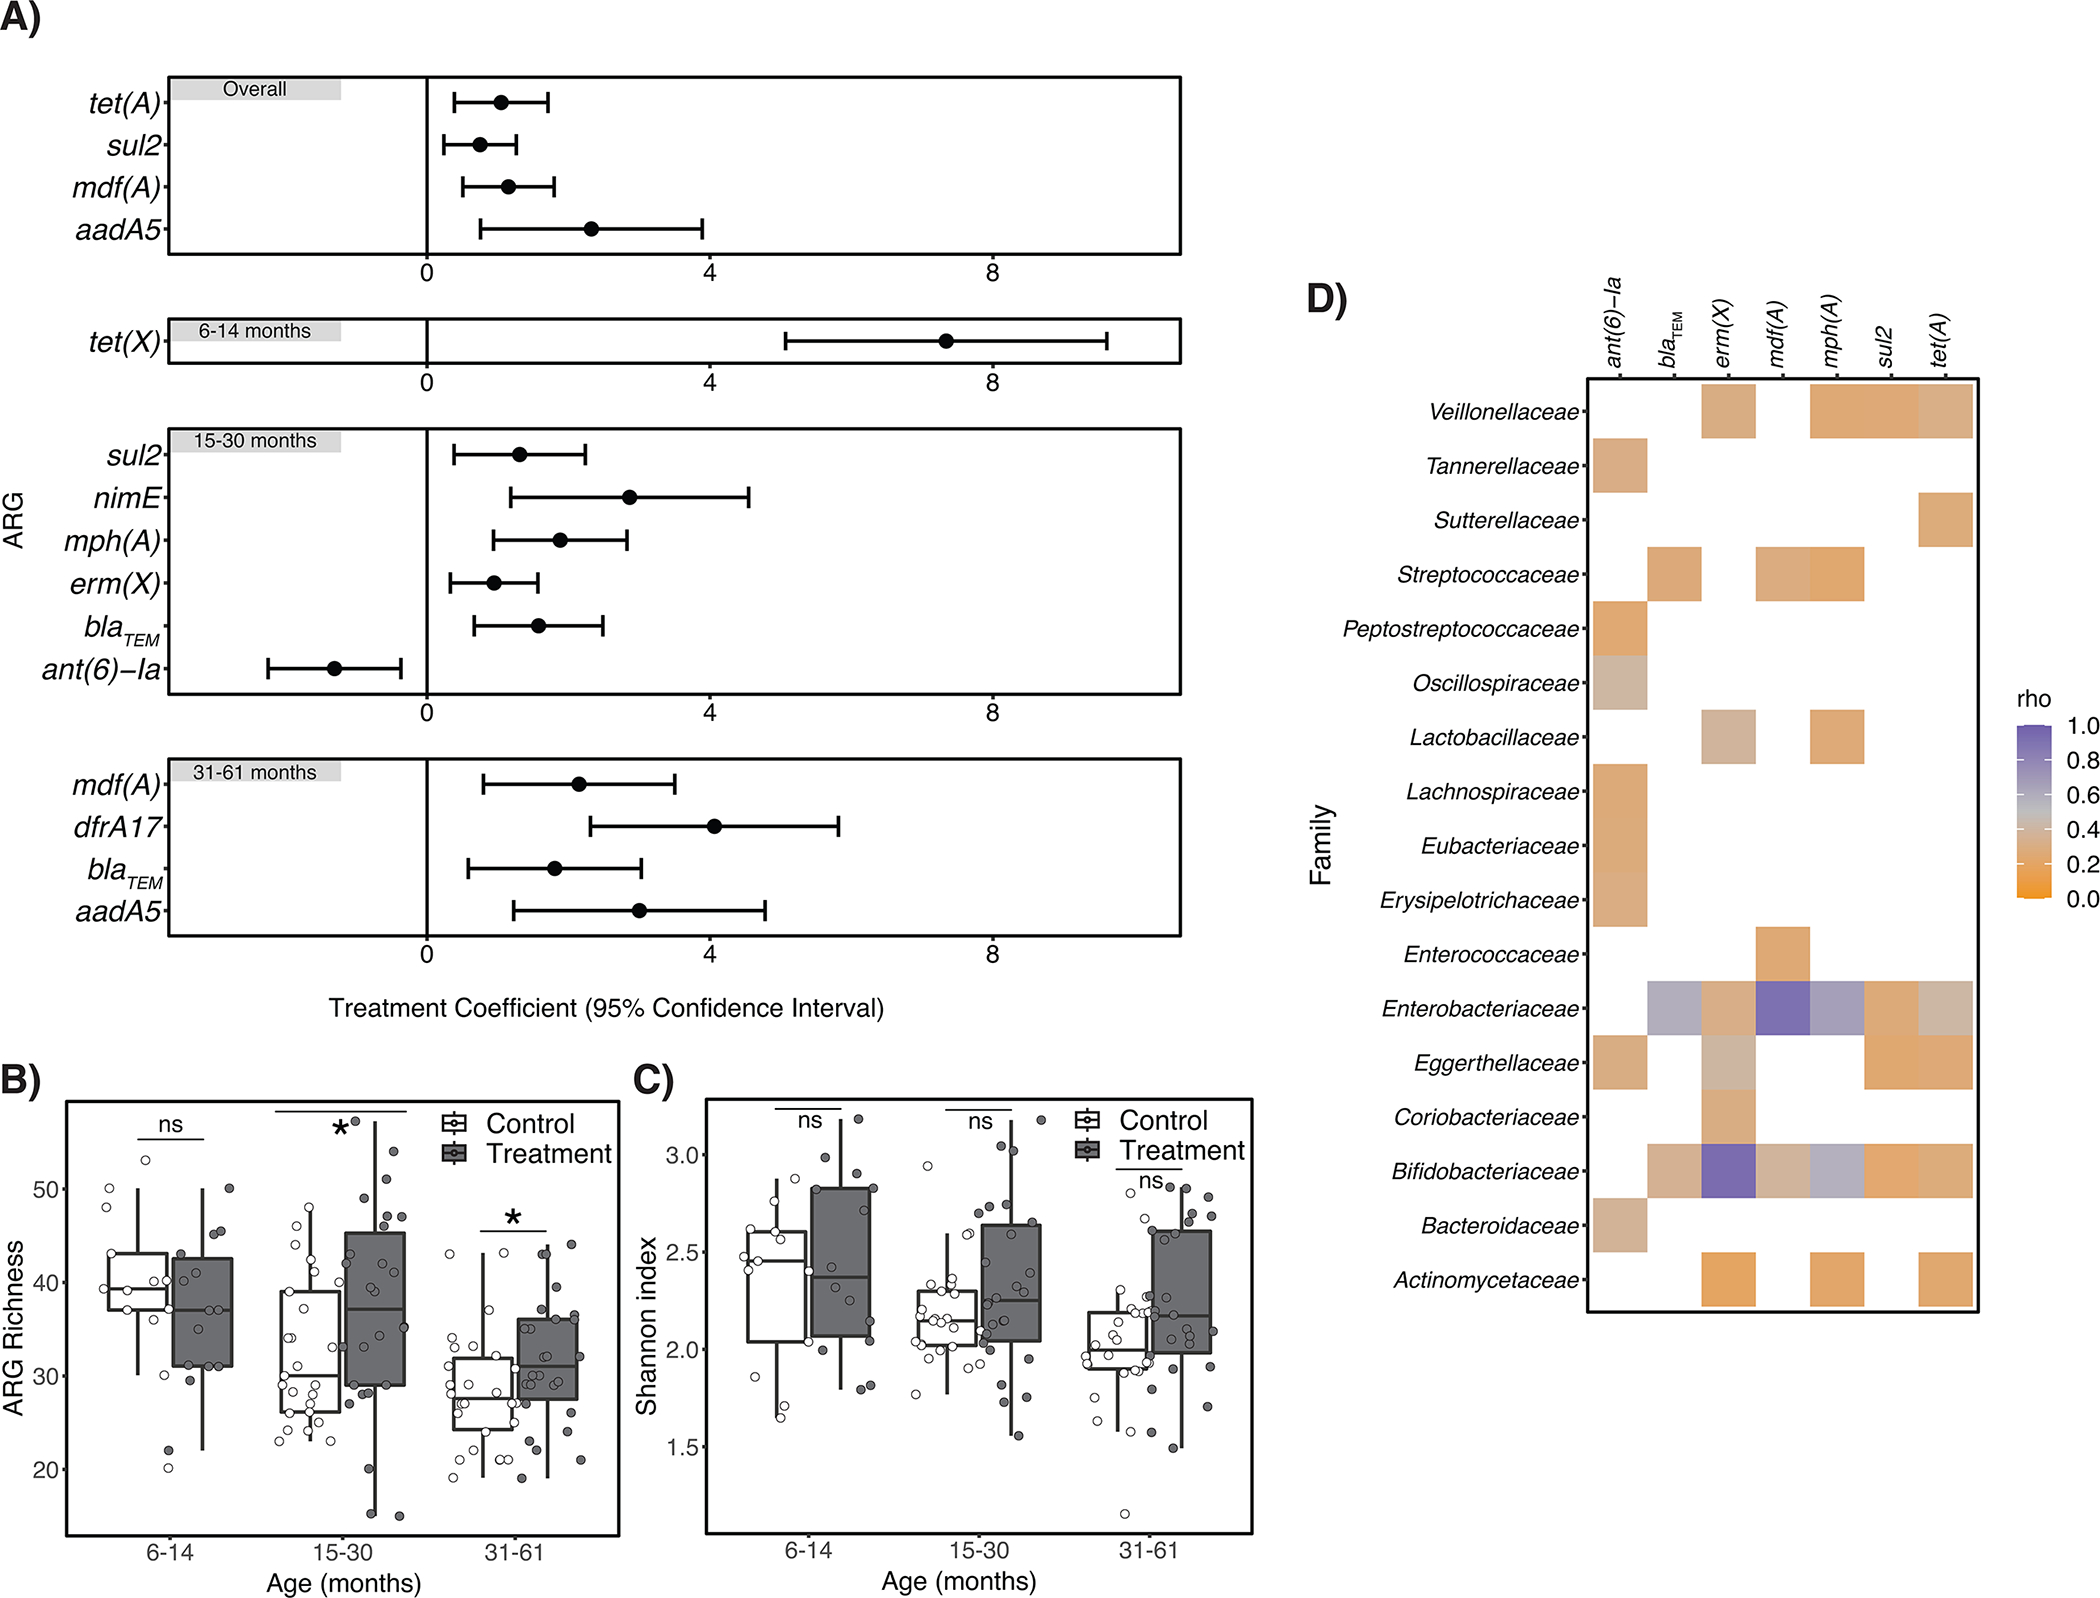
Figure 3. Effects of automated water chlorination on the richness, diversity, and relative abundance of antibiotic resistance genes (ARGs) harbored by children’s intestinal flora in urban Bangladesh.

Panel A) describes ARGs that were differentially abundant between treatment and control children (n=130 biologically independent samples), controlling for study site (and child age in the “Overall” panel only). Error bars depict the 95% confidence interval around the treatment coefficient. Positive treatment coefficient values indicate ARGs were more abundant among treatment children relative to controls; negative values indicate ARGs were less abundant. Panel B) depicts the estimated number of unique ARGs (i.e., ARG richness) detected in children’s fecal metagenomes, stratified by child age. Estimated ARG richness significantly differed between treatment and control children aged 15–30 months (p=0.015) and 31–61 months (p=0.016) controlling for study site and using the betta function of the R package breakaway. Panel C) depicts the Shannon diversity indices for treatment and control children, stratified by child age. There was no statistical association between treatment status and ARG diversity for any age stratum by two-sided Wilcoxon signed-rank test. For all box plots, center line indicates the median; box limits indicate the upper and lower quartiles; and whiskers indicate 1.5x interquartile range. For Panels A) – C) the number of biologically independent samples considered for each age strata is as follows: 6–14 months, n=27; 15–30 months, n=51; 31–61 months, n=52. Panel D) is a heatmap depicting the strength of the association between ARGs listed in Panel A) that occurred in at least half of samples and bacterial families that occurred in at least half of samples, as determined by Spearman correlation tests. Resulting rho values are only depicted for statistically significant correlations (p<0.05 after adjustment for multiple testing using the Benjamini–Hochberg method.).
Note: ns=non-significant. *indicates p≤0.05.
