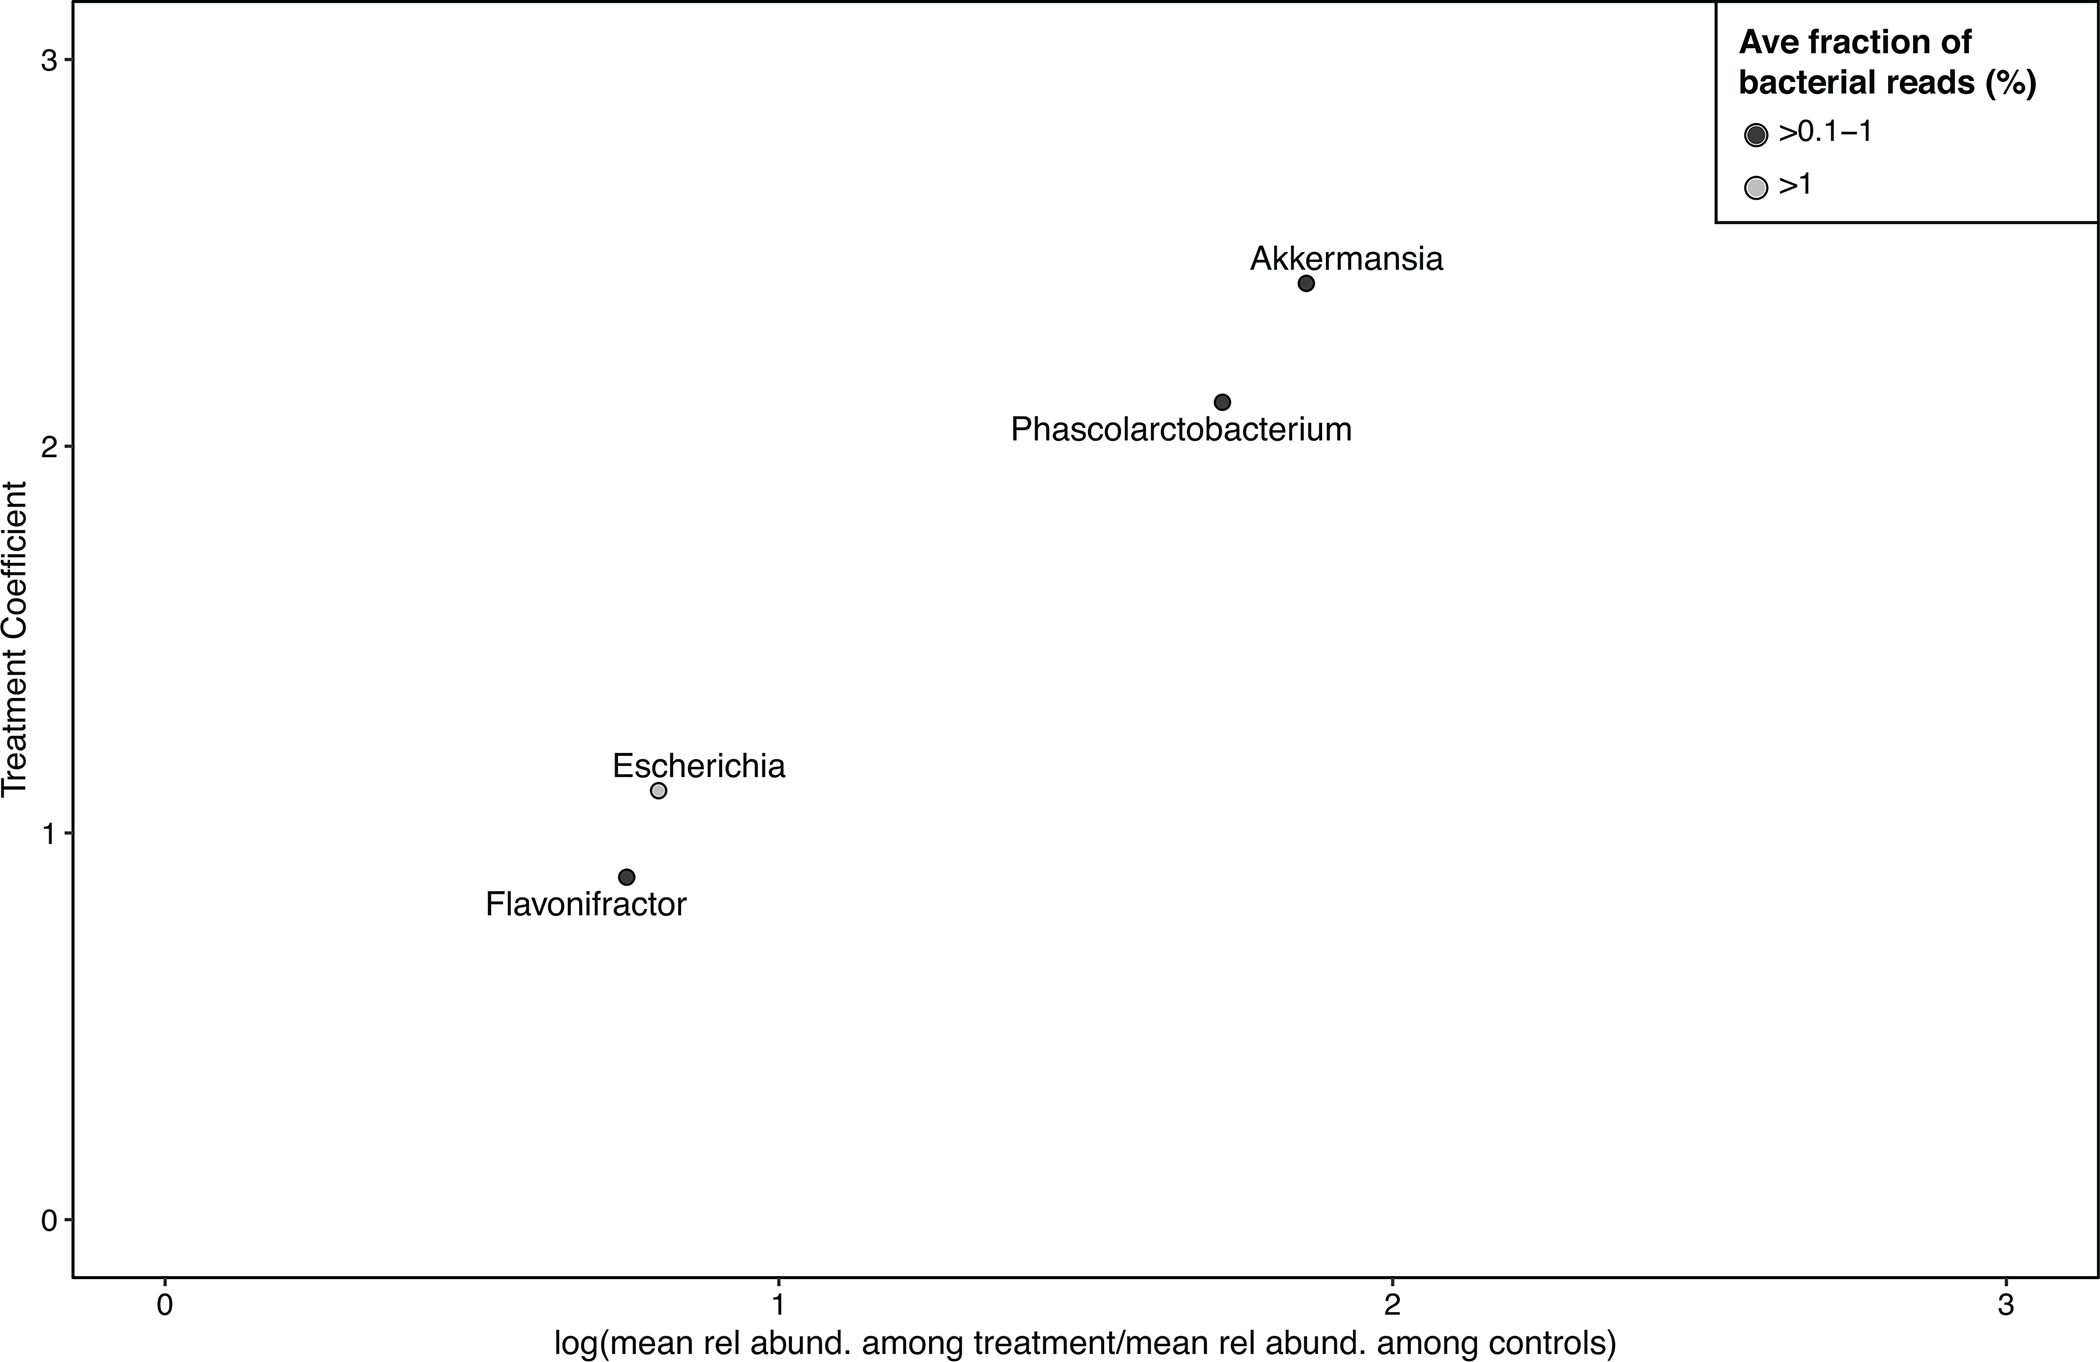
Extended Data. Fig. 1. Treatment coefficients generated by the R package corncob, representing the additive change in the logit-transformed relative abundance of bacterial genera between treatment and control children, compared to the log of the ratio of the mean relative abundance among treatment children to the mean relative abundance among control children, i.e., the log fold change.

Treatment coefficients generated by corncob generally approximate the log fold change.
