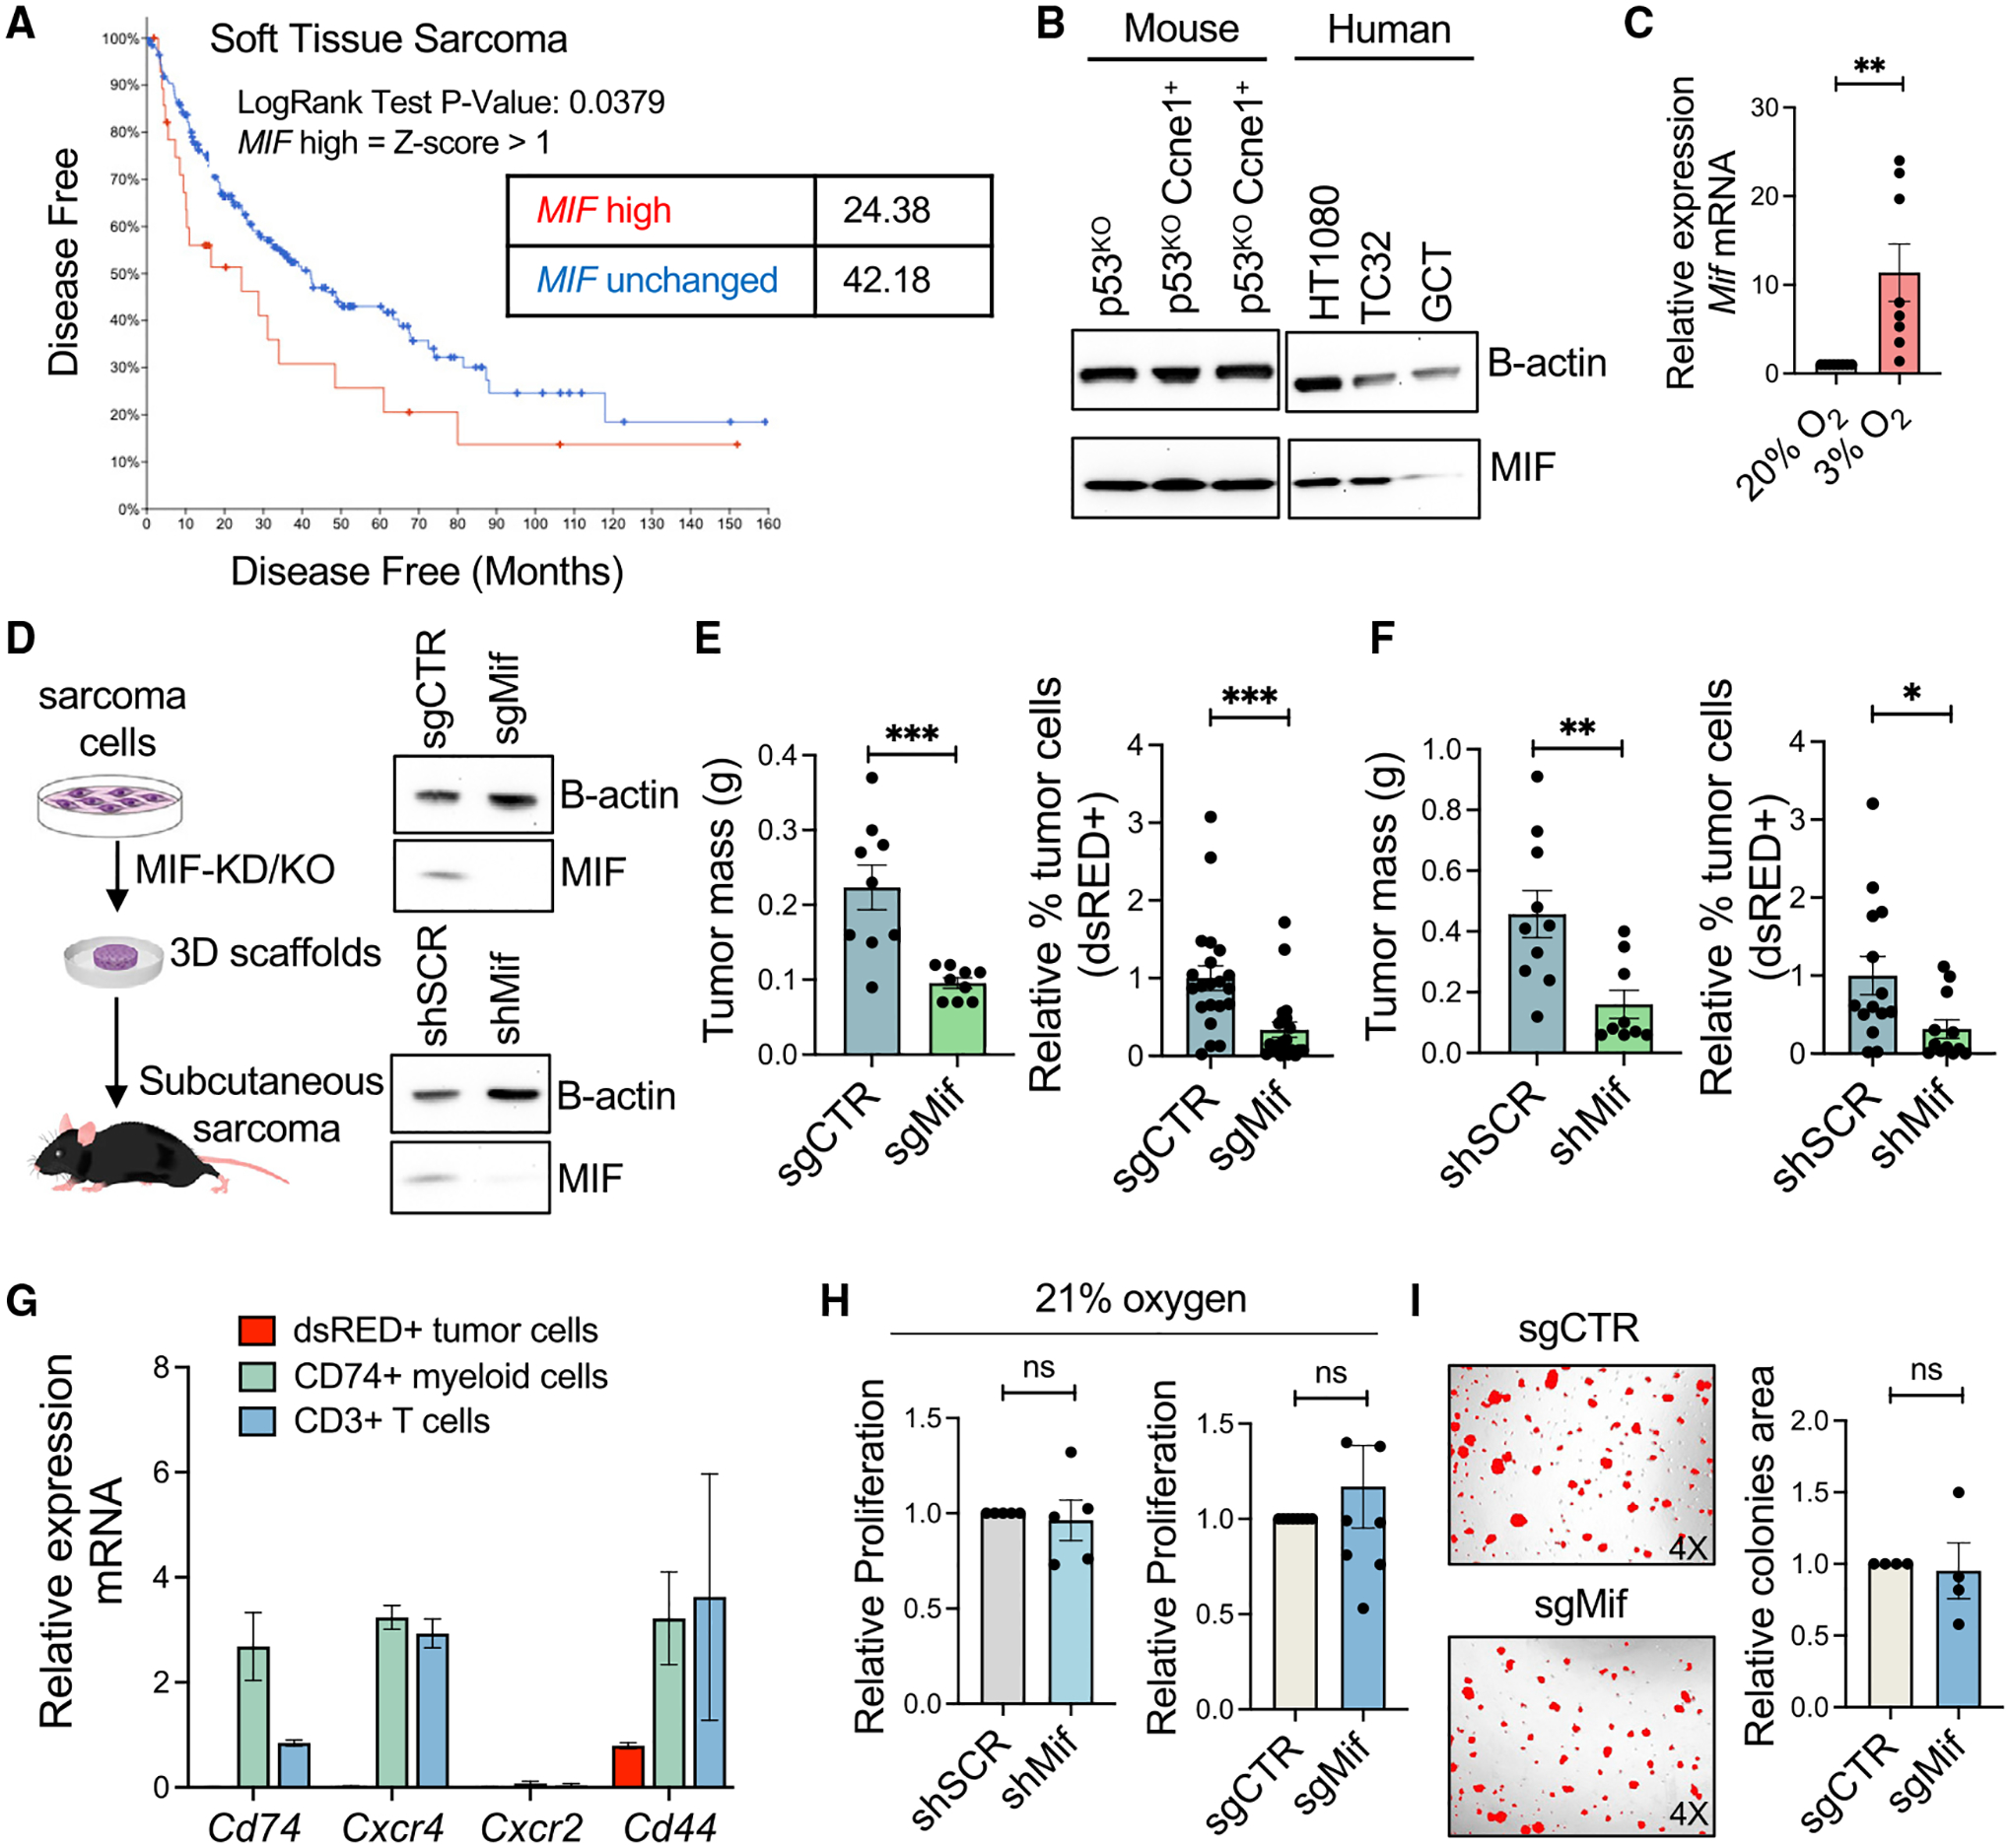
Figure 3. MIF silencing in the tumor cells reduces sarcoma growth.

(A) Survival analysis of human soft tissue sarcoma in the TCGA, stratified by MIF mRNA expression level.
(B) Western blot verification of MIF protein expression in mouse and human sarcoma cells.
(C) qRT-PCR analysis of Mif mRNA expression levels in normoxic (20% O2) or hypoxic (3% O2) culture conditions.
(D) Schematic representation of the generation of MIF-KO and KD sarcoma models and assessment of MIF KO or KD by western blot.
(E) Relative growth in vivo of MIF-WT (sgCTR) and MIF-KO (sgMif) sarcoma cells, represented as tumor mass at day 21 (left panel) and relative proportion of total digested tumor that was sarcoma cells (right panel).
(F) Relative growth in vivo of MIF-WT (shSCR) and MIF-KD (shMif) sarcoma cells, represented as tumor mass at day 21 (left panel) and relative proportion of total digested tumor that was sarcoma cells (right panel).
(G) Relative expression of Cd74, Cxcr2, Cd44, and Cxcr4 in dsRed+ tumor cells, CD74+ myeloid cells, and CD3+ T cells. All cells were FACS sorted from whole mouse tumors.
(H) Relative proliferation in vitro of MIF-WT (shSCR) and MIF-KD (shMif) sarcoma cells (left) and of MIF-WT (sgCTR) and MIF-KO (sgMif) sarcoma cells (right).
(I) Relative capacity of spheroid formation for the MIF-WT (sgCTR) and MIF-KO (sgMif) sarcoma cells in vitro.
Unless otherwise indicated, results are presented as mean ± SEM and results are compared by Student’s t test. *p < 0.05, **p < 0.01, and ***p < 0.001. See also Figure S3.
