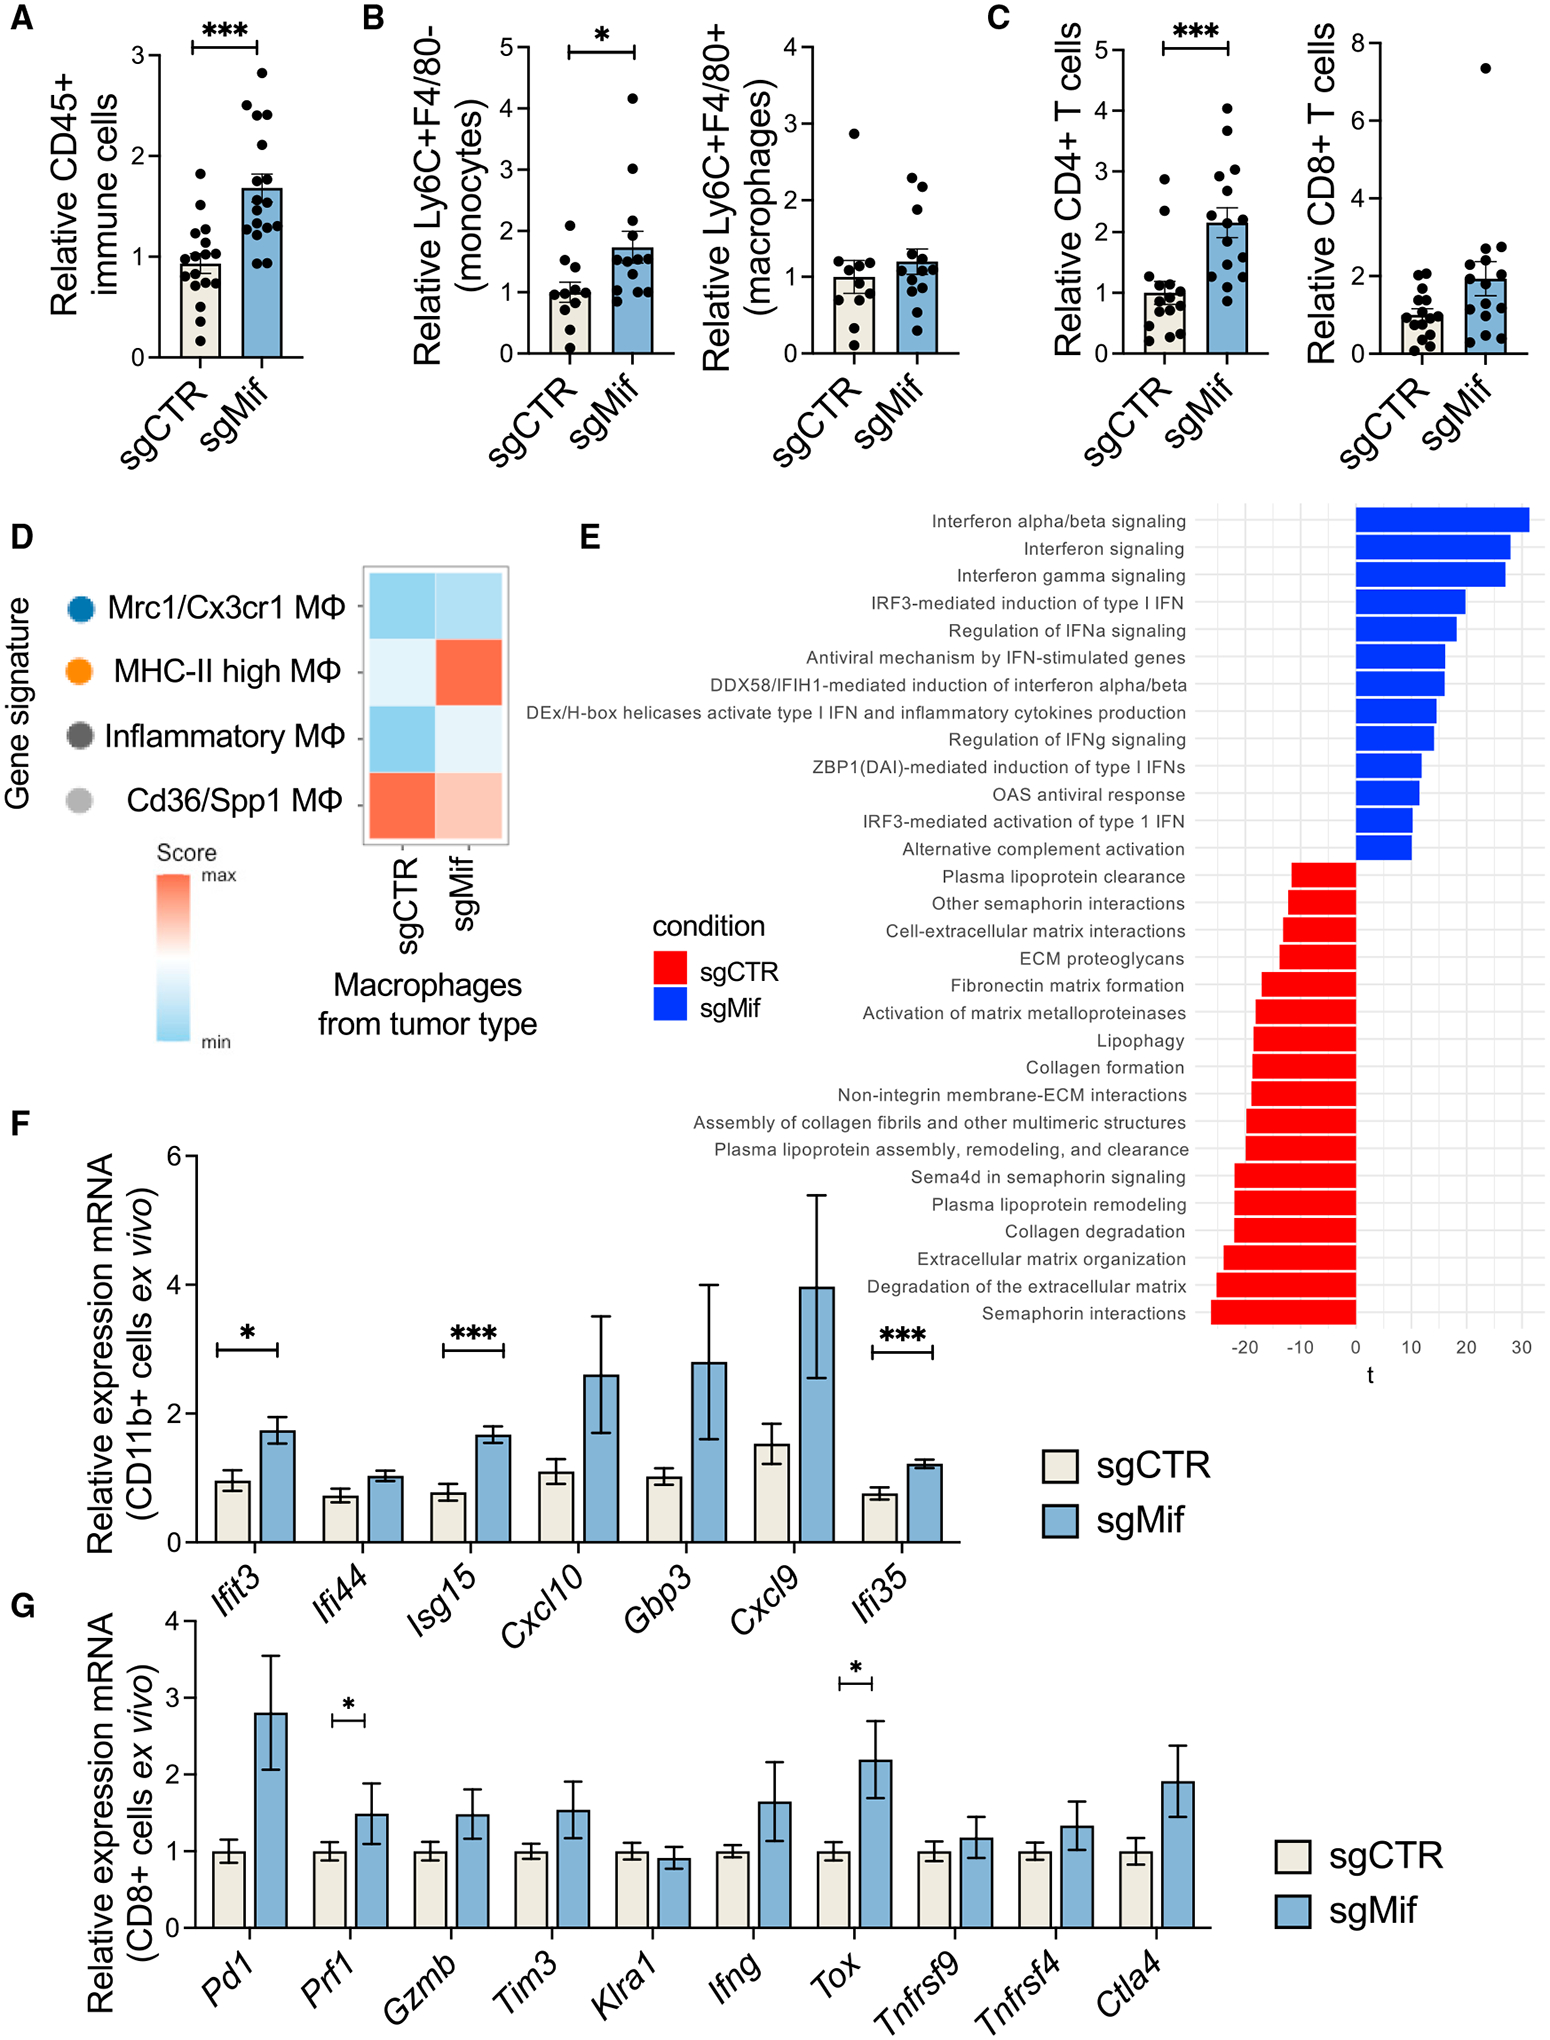
Figure 4. MIF silencing in the tumor cells re-shapes the myeloid microenvironment.

(A) Relative proportions in flow cytometry of immune cells (CD45+) infiltrating MIF-WT (sgCTR) and MIF-KO (sgMIFif) sarcomas.
(B) Relative proportions in flow cytometry of monocytes (CD45+LyC6+F4/80−) and macrophages (CD45+LyC6−F4/80+) infiltrating MIF-WT (sgSCR) and MIF-KO (sgMif) tumors.
(C) Relative proportions in flow cytometry of CD4+ and CD8+ T lymphocytes infiltrating MIF-WT (sgCTR) and MIF-KO (sgMif) tumors.
(D) Scoring the expression of four macrophage gene signatures (of the previously defined tumor-infiltrating macrophage subtypes; Figure 2) in macrophages coming from MIF-WT (sgCTR) or MIF-KO (sgMif) tumors, using Seurat’s Module Score method.
(E) Pathway analysis of macrophages infiltrating tumors generated by MIF-WT (sgCTR) or MIF-KO (sgMif) tumor cells.
(F) Differential expression of interferon-related genes in FACS-sorted myeloid cells (CD11b+) from the MIF-WT (sgCTR) and MIF-KO (sgMif) tumors.
(G) Differential expression of genes related to activation and exhaustion of T cells in FACS-sorted CD8+ T cells from the MIF-WT (sgCTR) and MIF-KO (sgMif) tumors.
Unless otherwise indicated, results are presented as mean ± SEM and results are compared by Student’s t test. *p < 0.05 and ***p < 0.001. See also Figure S4.
