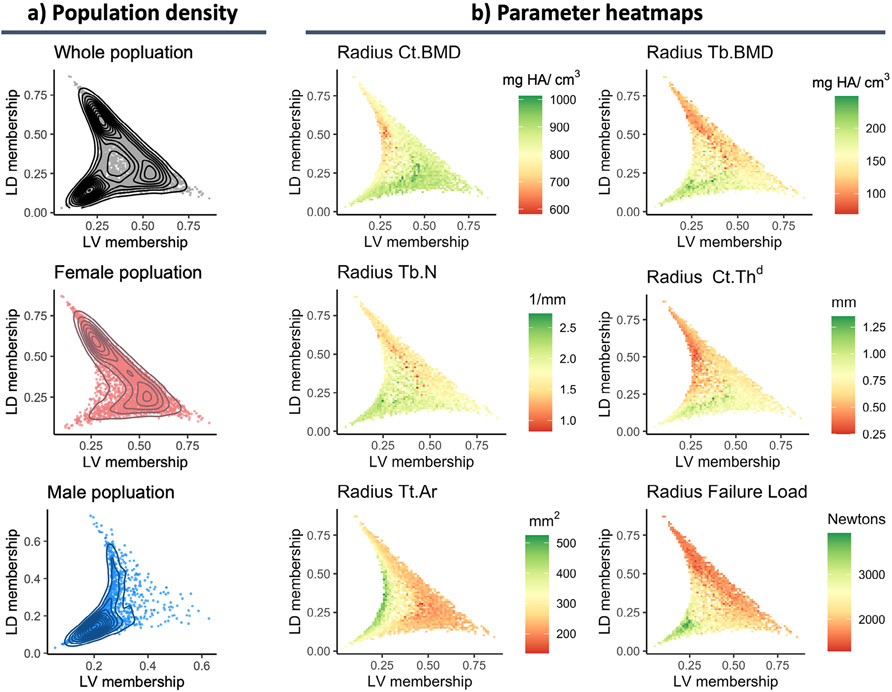
Fig. 1.
Characteristics of bone microarchitecture phenotypes. (A) Population distribution across phenotypes where each dot is an individual’s membership coefficient with the low density (LD) versus low volume (LV) phenotype. In this plot, the origin would represent complete association to the healthy phenotype. The topology profiles represent the population density across the phenotypes. (B) Heatmaps applied to the same plots shown in A to visualize the relationship between several continuous parameters and phenotype membership coefficients. Heatmaps of all parameters are provided in Supplemental Fig. S2.

