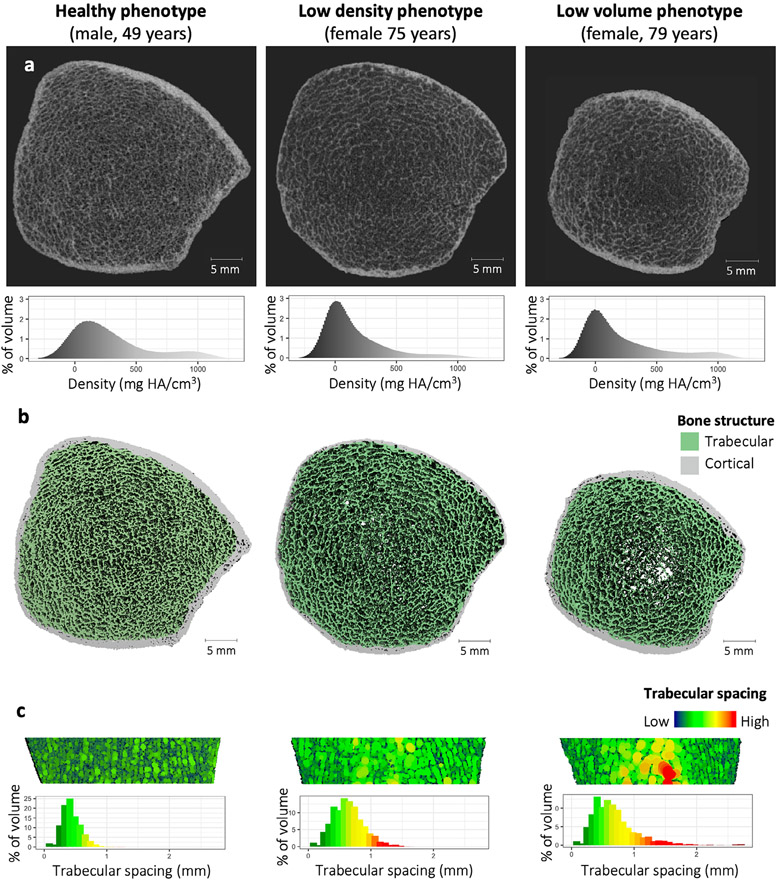
Fig. 2.
Examples of the three bone phenotypes. (A) Slice view of HR-pQCT images of the distal tibia from representative participants of each phenotype. The histograms show the distribution of the density values across the tibia scan region, reported in calibrated density units of mgHA/cm3. (B) Three-dimensional reconstruction of bone microarchitecture of the same distal tibia scans in A, with trabecular and cortical bone color labeled. (C) Sagittal cut-plane of reconstructed images from B, with heatmaps representing spacing between adjacent trabecular struts. The histograms show the distribution of trabecular spacing across the trabecular compartment of the entire distal tibia scan region.

