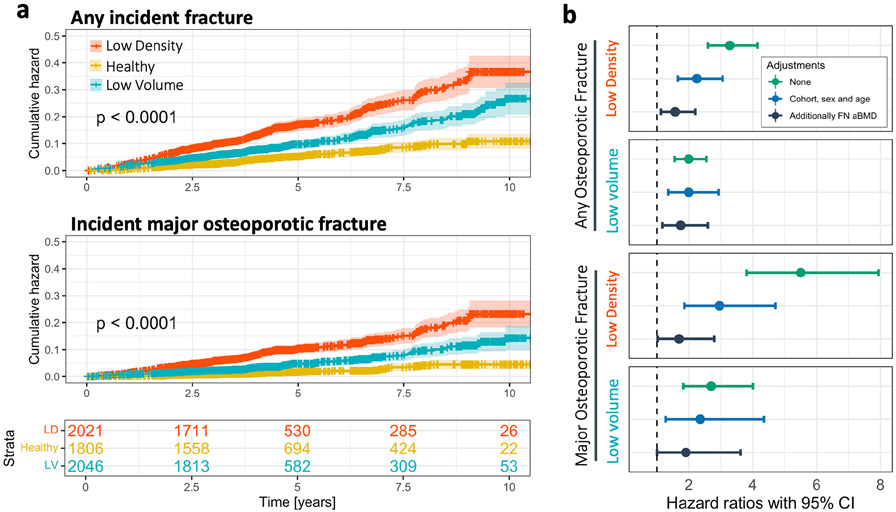
Fig. 5.
Association between incident fracture and phenotype. (A) Cumulative hazard functions determined using the Nelson–Aalen estimator, of any incident fracture and only major osteoporotic fracture. The shaded area in the plots represents the 95% confidence intervals (CI) of the cumulative hazard functions, and the censored observations are represented by the tick marks on the cumulative hazard curves. The p value represents the significance of the log-rank test performed comparing cumulative hazard functions. The bottom panel provides the proportion of the population remaining in each phenotype relative to follow-up time. (B) Hazard ratio (HR) and 95% CI for the association between phenotype and any incident fracture or only major osteoporotic fracture, with and without adjustments for covariates. The 95% CI are represented by the error bars. The HRs shown for the low density and low volume phenotypes are the risk relative to the healthy phenotype.

