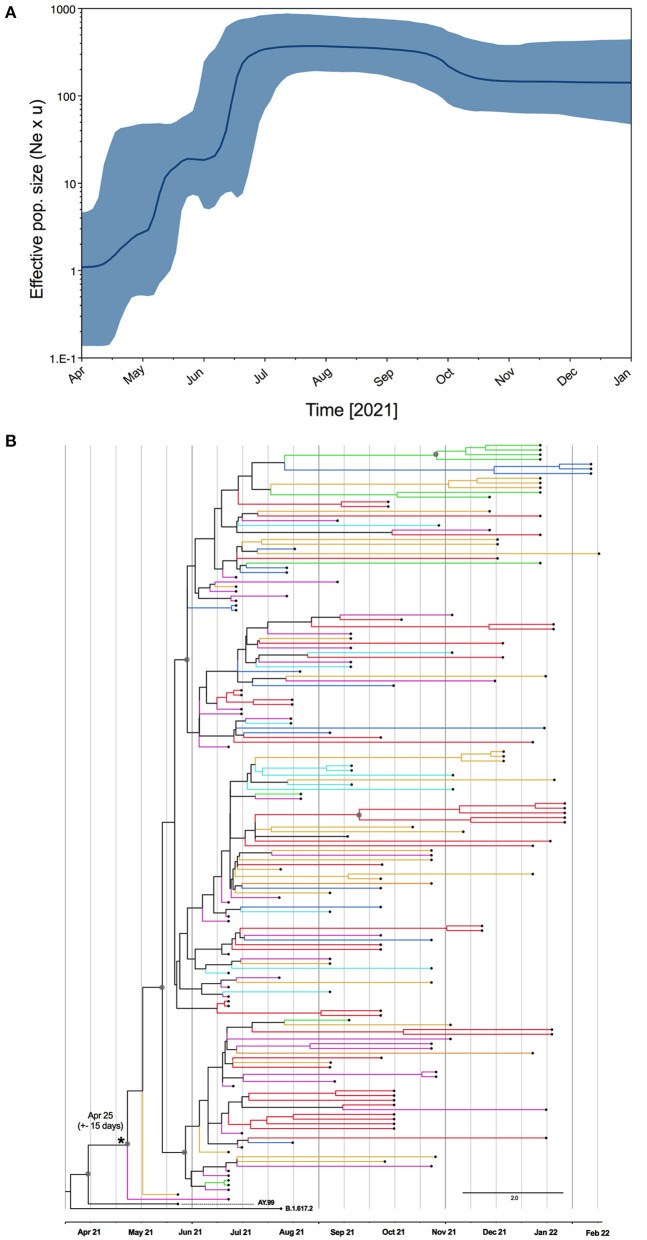
Figure 3.
(A) Bayesian skyline reconstruction of AY.99.2 lineage of SARS-CoV-2 in Brazil. The Y-axis represents relative genetic diversity estimated through the effective population size (Ne) and the generation time (u) the thick solid line represents the median value of the estimates, and the gray area means the 95% HPD. (B) Maximum clade credibility tree reconstruction for Brazilian Delta AY.99.2. The branches are colored by region of sampling as depicted in the map in Figure 2. Gray circles highlight the nodes with posterior probability >0.7.

